. 2025 Mar 31;39(6):e70465.
doi: 10.1096/fj.202402642R.

Retinoid X receptor agonist 9CDHRA mitigates retinal ganglion cell apoptosis and neuroinflammation in a mouse model of glaucoma

Affiliations

Retinoid X receptor agonist 9CDHRA mitigates retinal ganglion cell apoptosis and neuroinflammation in a mouse model of glaucoma

Devaraj Basavarajappa et al. FASEB J. .

Abstract

Glaucoma, a leading cause of irreversible blindness, is characterized by the progressive loss of retinal ganglion cells (RGCs) and optic nerve damage, often associated with elevated intraocular pressure (IOP). Retinoid X receptors (RXRs) are ligand-activated transcription factors crucial for neuroprotection, as they regulate gene expression to promote neuronal survival via several biochemical networks and reduce neuroinflammation. This study investigated the therapeutic potential of 9-cis-13,14-dihydroretinoic acid (9CDHRA), an endogenous retinoid RXR agonist, in mitigating RGC degeneration in a high-IOP-induced experimental model of glaucoma. We administered 9CDHRA to glaucomatous mice eyes via intravitreal injections and assessed its effects on endoplasmic reticulum (ER) stress markers, glial cell activation, and RGC survival. Our findings demonstrated that 9CDHRA treatment significantly protected inner retinal function and retinal laminar structure in high-IOP glaucoma. The treatment reduced ER stress markers, increased protein lysine acetylation, and diminished glial cell activation, leading to a significant decrease in apoptotic cells under glaucomatous conditions. These results suggest that 9CDHRA exerts neuroprotective effects by modulating key pathogenic pathways in glaucoma, highlighting its potential as a novel therapeutic strategy for preserving vision in glaucoma.

Keywords: 9CDHRA; ER stress; apoptosis; glaucoma; glial cell; intraocular pressure; neuroinflammation; neuroprotection; retinoid X receptors.


Figures

FIGURE 1
FIGURE 1
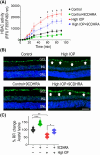
(A) Schematic diagram illustrating the experimental design and evaluation of retinal tissue for functionality, structure, and biochemical changes. (B) Chronic elevation of intraocular pressure (IOP) was induced in the eyes of wild‐type C57BL/6 mice through intracameral microbead injections for 8 weeks in different mouse groups, and the vehicle or 9CHDRA was administered via intravitreal injections. (C) Assessment of positive scotopic threshold responses (pSTR; averaged plots) in mouse eyes treated with or without 9CDHRA after 8 weeks of sustained elevated IOP. (D) Quantification of the pSTR amplitudes showing the significant protective effects of 9CDHRA on preserving the inner retinal function in high‐IOP induced glaucomatous injury conditions (NS, not significant, ****p < .0001, ***p < .001, one‐way ANOVA analysis with Tukey's multiple comparisons test, n = 10 per group).
FIGURE 2
FIGURE 2
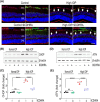
9CDHRA treatment protects inner retinal structure and optic nerve damage in chronic high‐IOP conditions. (A) Representative images of hematoxylin and eosin‐stained sagittal cross‐sections of the eyes, with arrows indicating changes in cell densities. Scale bar: 50 μm. Layers identified include the ganglion cell layer (GCL), inner nuclear layer (INL), and outer nuclear layer (ONL). (B) Quantification of cell density in the GCL from retinal hematoxylin and eosin‐stained images showing significant differences (NS, not significant, ****p < .0001, n = 4 per group). (C) Immunofluorescence staining of optic nerve cross‐sections using pNFH (SIM‐31), with green staining indicating pNFH+ areas. Scale bar: 50 μm for full sections and 10 μm for high magnification areas (boxed regions). (D) Quantification of immunoreactivity of pNFH in the optic nerves revealed significant differences, demonstrating the protective effects of 9CDHRA on the inner retinal structure and optic nerve under high‐IOP injury conditions. Statistical analysis was performed using one‐way ANOVA followed by Tukey's multiple comparisons test (NS, not significant, ****p < .0001, **p < .01, n = 4 per group).
FIGURE 3
FIGURE 3
Impact of 9CDHRA treatment on the reduction of ER stress markers under chronic high‐IOP conditions. (A) Immunofluorescence images of eye sections stained with CHOP (red), the neuronal marker NeuN (green), and DAPI (blue) (representative images, scale bar: 50 μm; GCL, ganglion cell layer; INL, inner nuclear layer; ONL, outer nuclear layer), demonstrating the upregulation of CHOP and its modulation with 9CDHRA treatment in high‐IOP retinas. Arrows indicate the increase in CHOP immunoreactivity in glaucomatous injury compared to controls and its reduction following 9CDHRA treatment. (B) Representative western blots showing the expression levels of CHOP in retinal tissues under normal and high‐IOP conditions. (C) Densitometric analysis quantifying CHOP blot densities normalized to β‐actin. (D) Immunoblot analysis displaying ATF4 expression levels (representative blots) in retinal tissues. (E) Densitometric quantification of ATF4 band intensities normalized to β‐actin. Statistical analysis of the western blot results shows that CHOP and ATF4 protein levels significantly decreased with 9CDHRA treatment compared to the untreated group in high‐IOP injury conditions (NS, not significant, ****p < .0001, one‐way ANOVA with Tukey's multiple comparisons test, n = 4 per group).
FIGURE 4
FIGURE 4
Effects of 9CDHRA treatment on HDAC inhibition and protein lysine acetylation. (A) Time‐dependent HDAC enzyme activity was measured in retinal tissue lysates from different groups of mice. The resulting data is plotted on a graph showing an increased HDAC activity in high‐IOP retinas, which decreases with 9CDHRA treatment. The dotted lines represent non‐linear regression least squares Sigmoidal fit (*p < .05). (B) Immunofluorescence images of the eye sections stained with acetyl lysine antibody (green) and DAPI (blue) (representative images: Scale bar, 50 μm; GCL, ganglion cell layer; INL, inner nuclear layer; ONL, outer nuclear layer), arrows indicate the changes in acetylated lysine staining in the GCL. (C) Quantitative immunoreactivity measurements reveal a significant upregulation of protein acetylation with 9CDHRA treatment (*p < .05, **p < .01, ***p < .001, one‐way ANOVA analysis with Tukey's multiple comparisons test; n = 4 per group).
FIGURE 5
FIGURE 5
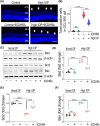
Eyes treated with 9CDHRA exhibit reduced apoptotic changes in the ganglion cell layer under experimental glaucoma conditions. (A) Assessment of TUNEL apoptotic changes conducted in the 100–700 μM region from the edge of the optic disk in retinal sections. The arrows indicate changes in TUNEL staining in the ganglion cell layer after 8 weeks of elevated IOP induction. The representative image shows TUNEL staining (red) and nuclear staining with DAPI (blue) (Scale bar = 50 μM. GCL, ganglion cell layer; INL, inner nuclear layer; ONL, outer nuclear layer). (B) Quantification of TUNEL‐positive cells in the GCL of retinas revealed a significant decrease in the number of TUNEL‐positive cells in the retinas treated with 9CDHRA under high‐IOP conditions (NS, not significant, ***p < .001, ****p < .0001, one‐way ANOVA with Tukey's multiple comparisons test, n = 4 per group). (C) Representative immunoblots displaying the expression levels of the apoptotic pathway proteins Bad, Bcl2, and Bax. The band intensities from the western blots were quantified densitometrically and normalized to β‐Actin for (D) Bad expression, (E) Bcl2 expression, and (F) Bax expression. Treatment with 9CDHRA significantly restored the changes in apoptotic markers under high‐IOP conditions (NS, not significant, ****p < .0001, one‐way ANOVA with Tukey's multiple comparisons test, n = 4 per group).
FIGURE 6
FIGURE 6
Upregulation of ABCA1 expression in the retinas treated with 9CDHRA. (A) Immunofluorescence images of retinal sections stained for ABCA1 (green) and DAPI (blue) (representative images, scale bar: 50 μm; ONL, outer nuclear layer; INL, inner nuclear layer; GCL, ganglion cell layer). ABCA1 expression is upregulated in the GCL with 9CDHRA treatment (arrows indicate changes in ABCA1 immunoreactivity). (B) Western blot analysis of retinal tissues showing ABCA1 protein levels (representative blots). (C) Densitometric quantification of ABCA1 expression (normalized to β‐actin) reveals a significant decrease in ABCA1 levels in high‐IOP retinas, with its upregulation following 9CDHRA treatment under both normal and high‐IOP conditions (**p < .01, ***p < .001, one‐way ANOVA with Tukey's multiple comparisons test, n = 4 per group).
FIGURE 7
FIGURE 7
Suppression of retinal glial activation with 9CDHRA under experimental glaucoma conditions. (A) Immunofluorescence images of eye sections stained with Iba1 (red) for microglia and DAPI (blue) (representative images, scale bar: 50 μm; ONL, outer nuclear layer; INL, inner nuclear layer; GCL, ganglion cell layer) demonstrate microglial activation and its modulation with 9CDHRA treatment in high‐IOP retinas (arrows indicate changes in Iba1 immunoreactivity). (B) Western blot analysis of retinal tissues for Iba1 levels following high‐IOP injury (representative blots). (C) Densitometric quantitative analysis of Iba1 blot densities (normalized to β‐actin) reveals increased Iba1 levels in high‐IOP retinas and a significant reduction with 9CDHRA treatment (NS, not significant, ****p < .0001, one‐way ANOVA with Tukey's multiple comparisons test, n = 4 per group). (D) Immunofluorescence images of eye sections stained with GFAP (green) and DAPI (blue) for analysis of reactive gliosis (Müller glia) (representative images, scale bar: 50 μm; GFAP expression and hypertrophy changes indicated by arrows). (E) Western blot analysis of GFAP protein expression in retinal lysates (representative blots). (F) Densitometric quantitative analysis of GFAP blots shows a significant reduction in GFAP expression with 9CDHRA treatment under high‐IOP injury conditions (NS, not significant, ****p < .0001, one‐way ANOVA with Tukey's multiple comparisons test, n = 4 per group).
FIGURE 8
FIGURE 8
9CDHRA treatment attenuates glial activation in the optic nerves in experimental glaucoma conditions. (A) Immunofluorescence images of optic nerve cross‐sections (representative, scale bar: 50 μm) stained for microglia with Iba1 (red). (B) Quantification of Iba1 immunoreactivity indicating the microglia activation induced by high IOP was significantly reduced following 9CDHRA treatment (NS, not significant, ***p < .001, ****p < .0001, one‐way ANOVA with Tukey's multiple comparisons test, n = 4 optic nerves per group). (C) Representative immunofluorescence images of optic nerve cross‐sections stained for reactive astrogliosis with GFAP (green), scale bar: 50 μm. (D) Quantitative analysis of GFAP immunoreactivity demonstrating 9CDHRA treatment significantly suppressed astrogliosis in experimental glaucomatous injury (NS, not significant, ***p < .001, ****p < .0001, one‐way ANOVA with Tukey's multiple comparisons test, n = 4 per group).

References

    1. Evans RM, Mangelsdorf DJ. Nuclear receptors, RXR, and the big bang. Cell. 2014;157:255‐266. - PMC - PubMed
    1. Sharma S, Shen T, Chitranshi N, et al. Retinoid X receptor: cellular and biochemical roles of nuclear receptor with a focus on neuropathological involvement. Mol Neurobiol. 2022;59:2027‐2050. - PMC - PubMed
    1. Gilardi F, Desvergne B. RXRs: Collegial Partners. In: Asson‐Batres MA, Rochette‐Egly C, eds. The Biochemistry of Retinoic Acid Receptors I: Structure, Activation, and Function at the Molecular Level. Springer Netherlands; 2014:75‐102.
    1. Osz J, McEwen AG, Poussin‐Courmontagne P, et al. Structural basis of natural promoter recognition by the retinoid X nuclear receptor. Sci Rep. 2015;5:8216. - PMC - PubMed
    1. Rastinejad F. Retinoic acid receptor structures: the journey from single domains to full‐length complex. J Mol Endocrinol. 2022;69:T25‐T36. - PMC - PubMed

MeSH terms

LinkOut - more resources