. 2025 May;40(5):881-895.
doi: 10.1002/mds.30160. Epub 2025 Mar 13.

Finely Tuned γ Tracks Medication Cycles in Parkinson's Disease: An Ambulatory Brain-Sense Study

Affiliations

Finely Tuned γ Tracks Medication Cycles in Parkinson's Disease: An Ambulatory Brain-Sense Study

Aaron Colombo et al. Mov Disord. 2025 May.

Abstract

Background: Novel commercial brain-sense neurostimulators enable us to contextualize brain activity with symptom and medication states in real-life ambulatory settings in Parkinson's disease (PD). Although various candidate biomarkers have been proposed for adaptive deep brain stimulation (DBS), a comprehensive comparison of their ambulatory profiles is lacking.

Objectives: To systematically compare the ambulatory neurophysiological dynamics and clinical properties of three candidate biomarkers-low-frequency, beta (β), and finely tuned γ (FTG) activity.

Methods: We investigated 14 PD patients implanted with the Medtronic Percept PC, who underwent up to two 4-week ambulatory multimodal recording periods on their regular medication and stimulation. Subthalamic nucleus local field potentials (LFPs) of low-frequency, β, and FTG activity were recorded. Additionally, objective motor symptom states, physical activity and heart rate using wearables, as well as medication-intake times, sleep-awake times, and subjective symptom states using diaries were co-registered. LFP dynamics were also compared to high-resolution in-hospital recordings under off/on dopaminergic medication and stimulation conditions.

Results: FTG reliably indexed off to on medication states in the ambulatory setting at the group and individual levels, and these spectral dynamics could be anticipated by high-resolution in-hospital recordings. Both FTG and low-frequency correlated with wearable-based dyskinesia scores, whereas diary-based dyskinesia events were only linked to FTG. Importantly, FTG indicated on-medication states regardless of the presence of dyskinesia and despite potential motion and heart rate artifacts. The 24-hour profile revealed large circadian power shifts that may overdrive medication-intake dynamics.

Conclusion: Despite the limitations of low-temporal resolution recordings, this work provides valuable insights into the real-life dynamics of biomarkers. Specifically, it highlights the utility of FTG as a primary and reliable indicator of medication states for adaptive DBS. © 2025 The Author(s). Movement Disorders published by Wiley Periodicals LLC on behalf of International Parkinson and Movement Disorder Society.

Keywords: Parkinson's disease; biomarkers; brain‐sense; closed‐loop, adaptive deep brain stimulation; home recording.


Figures

FIG. 1
FIG. 1
Method figure: Ambulatory multimodal data recording. Schematic illustration of the experimental setup with the main parts of the multimodal assessment over 4 weeks per study period. (A) Biomarker frequency selection for each hemisphere separately after running the BrainSense Setup (Signal Check) on the Medtronic tablet. For biomarker 1, β activity is selected, whereas for biomarker 2, either low frequency or FTG activity at half the stimulation frequency is selected, alternating if a second recording period took place. (B) Bi‐hemispheric registration of STN LFP of a preselected neurophysiological biomarker using the Percept BrainSense timeline feature of the sensing‐enabled Medtronic Percept PC. An average power value is saved over every 10‐minute time window. (C) Wearables were used for the collection of physical activity data, heart rate, and a dyskinesia score. (D) Paper‐based diaries were used for self‐assessment of the subjective motor state (+: dyskinetic, 0: optimal, −: akinetic), medication schedule, as well as wake‐up and go‐to‐bed times. LFP: local field potentials; STN: subthalamic nucleus; FTG: finely tuned γ. [Color figure can be viewed at wileyonlinelibrary.com]
FIG. 2
FIG. 2
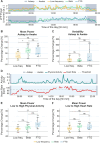
Asleep/awake LFP power difference and effects of physical activity and heart rate. (A) Two entire days of asleep and awake fluctuations in biomarkers in different frequency bands of the left and right STN of a representative subject. (B) Shows the percentage change in the mean power of the awake state compared to the asleep state of all subjects for the three biomarkers (low‐frequency activity: orange, β activity: green, FTG: blue). A positive value indicates a power increase during the awake compared to the asleep state. (C) Shows the change in power variability between the awake and asleep states of all subjects for the three biomarkers. A positive value indicates increased variability during awake compared to asleep. (D) Fluctuations in the physical activity state and the heart rate during 1 day. The dashed line presents the median within the full recording (awake states only) used to split the data into high and low activity and heart rate state, respectively. (E) Shows the percentage change in the mean power during high compared to low physical activity states of all subjects for the three biomarkers. A positive value indicates increased power during high compared to low activity state. (F) Shows the percentage change in mean power during high compared to low heart rate states of all subjects for the three biomarkers. A positive value indicates increased power during high compared to low heart rate. LFP, local field potentials; STN, subthalamic nucleus; FTG, finely tuned γ. [Color figure can be viewed at wileyonlinelibrary.com]
FIG. 3
FIG. 3
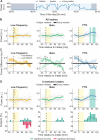
Impact of dopaminergic medication intakes on LFP power dynamics. (A) Asleep and awake fluctuation in FTG power in the STN of a representative subject within 1 day. Vertical lines represent the times of medication intakes. (B) Illustrates median power dynamic of the single subjects (gray line) and the group median in bold from 30 minutes before to 120 minutes after the medication intake for the three biomarkers (low‐frequency activity: orange, β activity: green, FTG: blue). The turquois shaded area indicates significant power changes compared to the baseline window (yellow shaded area, 0 to +30 minutes after medication intake). (C) Presents the median power dynamics at the first and last medication intakes of the day by contrasting them against the medication intakes in‐between the first and the last daily intakes. The shaded area illustrates the standard error of the group median. Significant time points are denoted with an asterisk. Before the intake and during the baseline period β activity: PFDR (−30, −20, −10, 0, 10, 30) = [0.03, 0.007, 0.005, 0.003, 0.008, 0.039]; FTG: PFDR (−30, −20, −10, 0, 10, 20) = [0.01, 0.01, 0.01, 0.01, 0.01 0.04], whereas post‐baseline β activity: PFDR (80, 90, 100, 110, 120) = [0.034, 0.005, 0.012, 0.003, 0.003]; FTG: PFDR (80, 90, 100, 110, 120) = [0.022, 0.01, 0.02, 0.013, 0.022], (Wilcoxon signed‐rank test). (D) Illustrates median power dynamic of the single subjects (gray line) and the group median in bold from 30 minutes before to 120 minutes after the medication intake for the three biomarkers when only considering the medication intakes in‐between the first and the last intakes of the day. The turquois shaded area indicates significant power changes compared to the baseline window. The bars below show the percentage of subjects showing a significant power change compared to baseline for each 10‐minute window. Turquois indicates a significant power increase, whereas red indicates a significant power decrease. LFP, local field potential; STN, subthalamic nucleus; FTG, finely tuned γ. [Color figure can be viewed at wileyonlinelibrary.com]
FIG. 4
FIG. 4
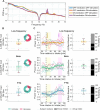
Medication response in hospital and ambulatory recordings. (A) Group average spectra of the high‐resolution LFP rest recordings (BrainSense Streaming mode) in the four medication/stimulation conditions. off medication/OFF stimulation (blue), off medication/ON stimulation (orange), on medication/OFF stimulation (yellow), and on medication/ON stimulation (violet). Medication alone preferentially reduces β band activity (most evident in 13–20 Hz), increases low‐frequency activity (5–12 Hz), and induces FTG within 70–90 Hz. Stimulation alone reduces the β activity (13–30 Hz), increases low‐frequency activity (5–12 Hz), and induces FTG at half the stimulation frequency (62.5 Hz, red curve). Combining stimulation and medication further amplifies stimulation‐entrained FTG at 62.5 Hz (violet curve). (B) Illustrates the difference in LFP power for the three selected biomarker frequencies (low‐frequency activity: orange, β activity: green, FTG: blue) between the medication on and off states (ON stimulation) measured in the hospital. Each dot represents a single subject. A positive value indicates a power increase from the off to the on medication state (turquois), whereas a negative value indicates a decrease (red). The pie chart shows the fraction of patients with an increase and decrease in the respective color. (C) Shows the effect of medication intake on the LFP power dynamic for the three selected biomarker frequencies in the ambulatory recording when considering only intakes between the first and last intakes of the day (Fig. 3C). On the right, the boxplot illustrates the difference between the mean power in the effect window (+80 to +110 minutes) and the baseline window (0 to +30 minutes). A positive value indicates a power increase in the effect window after medication intake, whereas a negative value indicates a decrease. Each line and dot represent a subject, and its color (red, turquois) is based on the result in (B). The gray line indicates the patient who did not participate in the in‐hospital high‐resolution recording. The bars present the percentage of patients (black) having the same trend in medication response in the hospital and in the ambulatory setting for the three biomarkers. LFP: local field potentials. FTG: finely tuned γ. [Color figure can be viewed at wileyonlinelibrary.com]
FIG. 5
FIG. 5
Biomarkers indexing symptom states. (A) Shows the correlation between the dyskinesia score and the LFP power at the three selected biomarker frequencies (low‐frequency: orange, β: green, FTG: blue) in the awake state within each subject. To correct for the influence of physical activity as well as for heart rate, partial correlation was applied. On the right, the bar plot indicates for each biomarker the percentage of subjects that had a significant correlation value. The color indicates whether a significant positive (turquois) or negative (red) correlation was observed. (B) Illustrates the mean LFP power of the three selected biomarker frequencies at the time points when the motor symptom state was marked in the symptom diaries. “0” represents an optimal motor state, whereas “−” indicates an akinetic state and “+” a dyskinetic state. (C) Illustrates the median ratio between the LFP power for the three biomarkers and the dyskinesia score when excluding the subgroup of intake windows with at least one self‐reported positive dyskinesia score post‐intake. Single subjects are reported in light gray and the group median in bold from 30 minutes before to 120 minutes after the medication intake. The turquois shaded area indicates significant changes in the ratio compared to the baseline window (yellow shaded area, 0 to +30 minutes after medication intake). LFP: local field potentials; FTG: finely tuned γ. [Color figure can be viewed at wileyonlinelibrary.com]

References

    1. Little S, Pogosyan A, Neal S, et al. Adaptive deep brain stimulation in advanced Parkinson disease. Ann Neurol 2013;74(3):449–457. 10.1002/ana.23951 - DOI - PMC - PubMed
    1. Arlotti M, Marceglia S, Foffani G, et al. Eight‐hours adaptive deep brain stimulation in patients with Parkinson disease. Neurology 2018;90(11):e971–e976. 10.1212/WNL.0000000000005121 - DOI - PMC - PubMed
    1. Bronte‐Stewart H, Beudel M, Ostrem JLA, et al. Adaptive DBS algorithm for personalized therapy in Parkinson's disease: ADAPT‐PD clinical trial methodology and early data (P1‐11.002). Neurology 2023;100(17_supplement_2):3204. 10.1212/wnl.0000000000203099 - DOI
    1. Neumann WJ, Gilron R, Little S, Tinkhauser G. Adaptive deep brain stimulation: from experimental evidence toward practical implementation. Mov Disord 2023;38(6):937–948. 10.1002/mds.29415 - DOI - PubMed
    1. Swann NC, De Hemptinne C, Thompson MC, et al. Adaptive deep brain stimulation for Parkinson's disease using motor cortex sensing. J Neural Eng 2018;15(4):46006. 10.1088/1741-2552/aabc9b - DOI - PMC - PubMed

Substances