A common longitudinal intensive care unit data format (CLIF) for critical illness research
- PMID: 40080116
- PMCID: PMC12167506
- DOI: 10.1007/s00134-025-07848-7
A common longitudinal intensive care unit data format (CLIF) for critical illness research
Erratum in
-
Correction: A common longitudinal intensive care unit data format (CLIF) for critical illness research.Intensive Care Med. 2025 Apr;51(4):836-839. doi: 10.1007/s00134-025-07869-2. Intensive Care Med. 2025. PMID: 40163136 Free PMC article. No abstract available.
Abstract
Rationale: Critical illness threatens millions of lives annually. Electronic health record (EHR) data are a source of granular information that could generate crucial insights into the nature and optimal treatment of critical illness.
Objectives: Overcome the data management, security, and standardization barriers to large-scale critical illness EHR studies.
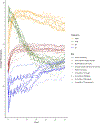
Methods: We developed a Common Longitudinal Intensive Care Unit (ICU) data Format (CLIF), an open-source database format to harmonize EHR data necessary to study critical illness. We conducted proof-of-concept studies with a federated research architecture: (1) an external validation of an in-hospital mortality prediction model for critically ill patients and (2) an assessment of 72-h temperature trajectories and their association with mechanical ventilation and in-hospital mortality using group-based trajectory models.
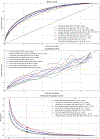
Measurements and main results: We converted longitudinal data from 111,440 critically ill patient admissions from 2020 to 2021 (mean age 60.7 years [standard deviation 17.1], 28% Black, 7% Hispanic, 44% female) across 9 health systems and 39 hospitals into CLIF databases. The in-hospital mortality prediction model had varying performance across CLIF consortium sites (AUCs: 0.73-0.81, Brier scores: 0.06-0.10) with degradation in performance relative to the derivation site. Temperature trajectories were similar across health systems. Hypothermic and hyperthermic-slow-resolver patients consistently had the highest mortality.
Conclusions: CLIF enables transparent, efficient, and reproducible critical care research across diverse health systems. Our federated case studies showcase CLIF's potential for disease sub-phenotyping and clinical decision-support evaluation. Future applications include pragmatic EHR-based trials, target trial emulations, foundational artificial intelligence (AI) models of critical illness, and real-time critical care quality dashboards.
Keywords: Critical care data; Machine learning; Temperature trajectory modeling.
© 2025. Springer-Verlag GmbH Germany, part of Springer Nature.
Figures


Update of
-
A Common Longitudinal Intensive Care Unit data Format (CLIF) to enable multi-institutional federated critical illness research.medRxiv [Preprint]. 2024 Sep 4:2024.09.04.24313058. doi: 10.1101/2024.09.04.24313058. medRxiv. 2024. Update in: Intensive Care Med. 2025 Mar;51(3):556-569. doi: 10.1007/s00134-025-07848-7. PMID: 39281737 Free PMC article. Updated. Preprint.
References
-
- Thoral PJ, Peppink JM, Driessen RH et al. (2021) Sharing ICU patient data responsibly under the Society of Critical Care Medicine/European Society of Intensive Care Medicine Joint Data Science Collaboration: The Amsterdam University Medical Centers Database (AmsterdamUMCdb) example: The Amsterdam university medical centers database (AmsterdamUMCdb) example. Crit Care Med 49:e563–e577 - PMC - PubMed
MeSH terms
Grants and funding
- K23 HL166783/HL/NHLBI NIH HHS/United States
- T32 HL007605/HL/NHLBI NIH HHS/United States
- R01LM014263/U.S. National Library of Medicine
- K23 HL169815/HL/NHLBI NIH HHS/United States
- K23 GM144867/GM/NIGMS NIH HHS/United States
- K08 HL150291/HL/NHLBI NIH HHS/United States
- U01 TR003528/TR/NCATS NIH HHS/United States
- T32 HL007891/HL/NHLBI NIH HHS/United States
- R35 GM155262/GM/NIGMS NIH HHS/United States
- K08 CA270383/CA/NCI NIH HHS/United States
- R01 LM014263/LM/NLM NIH HHS/United States
- R01 DK126933/DK/NIDDK NIH HHS/United States
- K23 HL169743/HL/NHLBI NIH HHS/United States
- R01 DA051464/DA/NIDA NIH HHS/United States
- R01 LM013337/LM/NLM NIH HHS/United States
LinkOut - more resources
Full Text Sources

