. 2025 Jun;24(6):e70035.
doi: 10.1111/acel.70035. Epub 2025 Mar 13.

Compressive Forces Induce Epigenetic Activation of Aged Human Dermal Fibroblasts Through ERK Signaling Pathway

Affiliations

Compressive Forces Induce Epigenetic Activation of Aged Human Dermal Fibroblasts Through ERK Signaling Pathway

Hui Liu et al. Aging Cell. 2025 Jun.

Abstract

Age-related changes in human dermal fibroblasts (HDFs) contribute to impaired wound healing and skin aging. While these changes result in altered mechanotransduction, the epigenetic basis of rejuvenating aging cells remains a significant challenge. This study investigates the effects of compressive forces on nuclear mechanotransduction and epigenetic rejuvenation in aged HDFs. Using a compressive force application model, the activation of HDFs through alpha-smooth muscle actin (ɑ-SMA) is demonstrated. Sustained compressive forces induce significant epigenetic modifications, including chromatin remodeling and altered histone methylation patterns. These epigenetic changes correlate with enhanced cellular migration and rejuvenation. Small-scale drug screening identifies the extracellular signal-regulated kinase (ERK) signaling pathway as a key mediator of compression-induced epigenetic activation. Furthermore, implanting aged cell spheroids into an aged skin model and subjecting the tissue to compressive forces resulted in increased collagen I protein levels. Collectively, these findings demonstrate that applying compressive force to aged fibroblasts activates global epigenetic changes through the ERK signaling pathway, ultimately rejuvenating cellular functions with potential applications for wound healing and skin tissue regeneration.

Keywords: ERK signaling pathway; epigenetic activation; human dermal fibroblasts; mechanical rejuvenation.


Conflict of interest statement

The authors declare no conflicts of interest.

Figures

FIGURE 1
FIGURE 1
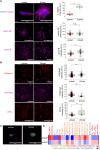
Establishment of 3D collagen hydrogel in vitro model upon compressive forces and characterization activation, rejuvenation, and memory properties of the regenerated phenotypes. (A) Schematic of 3D in vitro collagen model (single cell embedding and spheroid embedding) and illustration of the cell culture process. (B) Representative ɑSMA immunofluorescence confocal images and quantification data per image of mean intensity in single cell model and spheroid, using aged HDFs. Nucleus is labeled in blue. (Scale bar, 100 μm). (C) Representative pMLC immunofluorescence confocal images and quantification data per image of mean intensity. Nucleus is labeled in blue. (Scale bar, 100 μm). (D) Representative Beta‐galactosidase staining confocal images and quantification data per image of mean intensity. (Scale bar, 100 μm). (E) 3D nucleus construction and representative ɑSMA immunofluorescence confocal images under load and load removal condition. (Scale bar, 100 μm). (Unit in green box is μm). (F) Quantification data of ɑSMA mean intensity per image, nucleus volume, Z project area of nucleus, and roundness of nucleus. All the experiments were repeated at least three times independently with similar results. p values in (B–D) were calculated by unpaired, two‐tailed Student's t‐test. p values in (F) were calculated by the one‐way ANOVA method with Tukey's post hoc test. *p < 0.05; ** p < 0.01; ***p < 0.001; no asterisks means not significant. Source data are provided as a Source Data file.
FIGURE 2
FIGURE 2
Mechanical force stabilizes microtubule and facilitates chromatin remodeling. (A) Representative α‐tubulin, Lamin A/C, and Lamin B immunofluorescence confocal images and quantification data per cell of mean intensity. Nucleus is labeled in blue. (Scale bar, 50 μm and 100 μm). (B) Representative H3K9me3, H3K4me3, and HP1a immunofluorescence confocal images and quantification data per nucleus of mean intensity. (Scale bar, 100 μm). (C) Representative gray images from DAPI in unload condition and load condition. (Scale bar, 50 μm). (D) Heatmap of chromatin and nucleus morphology analysis. All the experiments were repeated at least three times independently with similar results. p values in (A, B) were calculated by unpaired, two‐tailed Student's t‐test. *p < 0.05; **p < 0.01; ***p < 0.001; no asterisks means not significant. Source data are provided as a Source Data file.
FIGURE 3
FIGURE 3
Mechanical load enhances cell migration via nucleus‐cytoskeleton axis. (A) Windrose plots displaying the distance of the migrated cell nucleus to the center of one spheroid. (B) Schematic illustration of inhibitor targets. (C) Table for inhibitors' description. (D) Representative immunofluorescence confocal images to check spheroid spreading. Nucleus is labeled in blue. F‐Actin is labeled in green. (Scale bar, 300 μm). (E) Quantification data of the spread area of the spheroid. All the experiments were repeated at least three times independently with similar results. p values in (E) were calculated by unpaired, two‐tailed Student's t‐test. Other groups are compared to the 2x load group. *p < 0.05; **p < 0.01; ***p < 0.001; no asterisks means not significant. Source data is provided as a Source Data file.
FIGURE 4
FIGURE 4
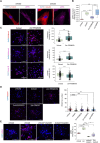
ERK role in chromatin remodeling, DNA damage response, and gene expression regulation. (A) Representative ERK phosphorylation immunofluorescence confocal images and quantification data of mean intensity per cell (some images shown in Figure S8). Nucleus is labeled in blue. α‐tubulin is labeled in red. pERK is labeled in magenta. (Scale bar, 50 μm). (B) Representative H3K9me3, H3K4me3 and Lamin B immunofluorescence confocal images and quantification data of mean intensity per nucleus. Nucleus is labeled in blue. (Scale bar, 100 μm). (D) Representative γH2AX immunofluorescence confocal images and quantification data of foci number per nucleus. (Scale bar, 100 μm). (E) Representative ɑSMA immunofluorescence confocal images and quantification data of mean intensity per image. Nucleus is labeled in blue. (Scale bar, 100 μm). All the experiments were repeated at least three times independently with similar results. p values in (B, D, E) were calculated by the one‐way ANOVA method with Tukey's post hoc test. p values in (C) were calculated by unpaired, two‐tailed Student's t‐test. *p < 0.05; **p < 0.01; ***p < 0.001; no asterisks means not significant. Source data is provided as a Source Data file. “2xL” is an abbreviated notation for “2x load.”
FIGURE 5
FIGURE 5
RNAseq analysis. (A) Volcano plot of significant genes in 2x load group compared to unload condition and GO Biological process analysis. (fold change > 2, adjusted p value < 0.1). 278 genes upregulated in 2x load compared to unload. (B) Volcano plot of significant genes in 2x load group compared to PD condition and GO Biological process analysis. PD condition means PD98059 inhibitors plus load condition. (fold change > 1, adjusted p value < 0.1). 612 genes upregulated in 2x load compared to PD. (C) KEGG pathway analysis in the above two DEG lists (278 DEG list and 612 DEG list). (D) The heatmaps show the gene expression level in different groups such as ERK‐related genes, microtubule‐related genes, migration‐related genes, DNA repair‐related genes, and rejuvenation‐related genes.
FIGURE 6
FIGURE 6
Implanted reprogrammed single cells and spheroids show activation properties under compressive force in an FT AGED skin model. (A) Representative images (20× magnification, Nikon) of collagen I. (Scale bar, 100 μm). Normalized intensity plots of collagen I at the cell‐implanted regions from at least three replicates. S + L group: Inject single cells under compressive force; O + L group: Inject spheroids under compressive force. (B) Illustration of the mechanism of compressive force in cellular rejuvenation. Created with BioRender.com. MT, microtubule.

References

    1. Andreu, I. , Falcones B., Hurst S., et al. 2021. “The Force Loading Rate Drives Cell Mechanosensing Through Both Reinforcement and Cytoskeletal Softening.” Nature Communications 12, no. 1: 4229. 10.1038/s41467-021-24383-3. - DOI - PMC - PubMed
    1. Berti, D. A. , and Seger R.. 2017. “The Nuclear Translocation of ERK.” In ERK Signaling, edited by Jimenez G., vol. 1487, 175–194. Springer. 10.1007/978-1-4939-6424-6_13. - DOI - PubMed
    1. Cui, Y. , Hameed F. M., Yang B., et al. 2015. “Cyclic Stretching of Soft Substrates Induces Spreading and Growth.” Nature Communications 6, no. 1: 6333. 10.1038/ncomms7333. - DOI - PMC - PubMed
    1. Damodaran, K. , Venkatachalapathy S., Alisafaei F., et al. 2018. “Compressive Force Induces Reversible Chromatin Condensation and Cell Geometry–Dependent Transcriptional Response.” Molecular Biology of the Cell 29, no. 25: 3039–3051. 10.1091/mbc.E18-04-0256. - DOI - PMC - PubMed
    1. Du, W. , Adam Z., Rani R., Zhang X., and Pang Q.. 2008. “Oxidative Stress in Fanconi Anemia Hematopoiesis and Disease Progression.” Antioxidants & Redox Signaling 10, no. 11: 1909–1921. 10.1089/ars.2008.2129. - DOI - PMC - PubMed

Substances

LinkOut - more resources