. 2025 Mar 18;122(11):e2412522122.
doi: 10.1073/pnas.2412522122. Epub 2025 Mar 13.

How spatiotemporal dynamics can enhance ecosystem resilience

Affiliations

How spatiotemporal dynamics can enhance ecosystem resilience

Pablo Moreno-Spiegelberg et al. Proc Natl Acad Sci U S A. .

Erratum in

Abstract

We study how self-organization in systems showing complex spatiotemporal dynamics can increase ecosystem resilience. We consider a general simple model that includes positive feedback as well as negative feedback mediated by an inhibitor. We apply this model to Posidonia oceanica meadows, where positive and negative feedbacks are well documented, and there is empirical evidence of the role of sulfide accumulation, toxic for the plant, in driving complex spatiotemporal dynamics. We describe a progressive transition from homogeneous meadows to extinction through dynamical regimes that allow the ecosystem to avoid the typical ecological tipping points of homogeneous vegetation covers. A predictable sequence of distinct dynamical regimes is observed as mortality is continuously increased: turbulent regimes, formation of spirals and wave trains, and isolated traveling pulses or expanding rings, the latter being a harbinger of ecosystem collapse, however far beyond the tipping point of the homogeneous cover. The model used in this paper is general, and the results can be applied to other plant-soil spatially extended systems, regardless of the mechanisms behind negative and positive feedbacks.

Keywords: excitability; plant–soil interactions; resilience; traveling pulses; vegetation patterns.


Conflict of interest statement

Competing interests statement:The authors declare no competing interest.

Figures

Fig. 1.
Fig. 1.
Comparison of aerial images of P. oceanica patterns (AD) with numerical simulations of Eq. 1 (EH). From Left to Right: turbulent regime, target pattern formed by two counterrotating spirals, wave trains, and expanding ring. Simulations are performed for (E) ω=0.0016, (F) ω=0.0016, (G) ω=0.08, and (H) ω=0.096. Other parameters: α=1.6, τ=6.25. Simulation (F) is obtained from initial radial Gaussian plant and toxin distributions. The centers of the initial Gaussians are shifted, breaking the rotational symmetry. The formation process of this structure, as well as aerial images of target patterns in different stages of development, are included in SI Appendix. Simulation (H) is obtained from an initial radial Gaussian plant distribution. Simulations (E and G) are snapshots of Fig. 3 at the corresponding value of ω. Panels (A and D) are taken from high-resolution drone images at (39°5345,1N, 3°0454,3E) and (39°5353,0N, 3°0455,0E). Panels (B and C) are taken from Google Earth at (39°5418,0N, 3°0620,2E) and (32°128,6N, 23°1642,5E). Movies showing simulations (EH) can be found in Movies S3, S6, S8, and S9 respectively).
Fig. 2.
Fig. 2.
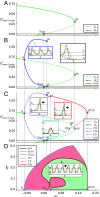
Bifurcation diagrams of Eq. 1. (AC) Maximum plant density of different spatiotemporal solutions as a function of the mortality rate ω. In (A) only solutions of the system without space (temporal system) are shown for τ=0, corresponding to the case of a system with direct negative feedback. Green lines correspond to steady populated solutions (S±) and black lines to the bare state (S0). Stable (unstable) solutions are represented by solid (dashed) lines. Labeled dots indicate bifurcation points explained in the text. Panel (B) extends to solutions with τ0. In this case, the noninstantaneous negative feedback mediated by toxins destabilizes S+ to homogeneous temporal oscillations (PO). The solid blue line corresponds to the extreme values of the limit cycle. Insets show the temporal evolution of plant density and toxin concentration in the oscillatory (blue) and excitable (gray) regimes. Panel (C) shows the bifurcation diagram of the full spatiotemporal system and, in addition to the solutions of the temporal system (homogeneous solutions), it includes traveling pulses on S (TP, purple lines), traveling pulses on S0 (TP0, red lines), and localized steady states on S0 (LSS, light blue lines). Notice that considering space, PO are unstable. Insets in panel (C) show the spatial profiles of TP (purple), TP0 (red), and LSS (light blue). Panel (D) shows the phase diagram of wave trains. Depending on the mortality rate ω, wave trains with wavenumber k are stable (unstable) within the green (red) shaded area. The existence region of wave trains is limited on the Left by the marginal stability curve (MSC, light blue curve) where small amplitude wave trains emerge from S+ and limited on the Right by a fold of wave trains (green curve). The stability region (green shade) is delimited by an Eckhaus instability (Eck, dark red curve). Solutions with k=0 are marked with color lines corresponding to those shown in panel (A). Note how k=0 solutions can be homogeneous oscillatory solutions (PO, dark blue line) or traveling pulses (TP, purple line, and TP0, red line). The transitions between these k=0 solutions correspond to the bifurcations shown in panel (C), indicated by vertical dotted gray lines. The Inset in panel (D) shows the profile of a wave train with k=0.25 for ω=0.046, marked with a black dot in the panel.
Fig. 3.
Fig. 3.
Mean plant density as a function of ω from a spatially extended simulation with a gradual increase in mortality over time (black dots). The homogeneous populated steady states S± and bare soil S0 are shown as green and black lines, respectively. The mean plant density of the homogeneous periodic oscillation, PO, is represented by a blue dashed line. The stationary and periodic homogeneous solutions correspond to those in Fig. 2B. Snapshots of the population density corresponding to the orange points in the plot are shown in Insets AF, illustrating distinct spatiotemporal patterns: turbulent regime (AC), spiral formation around defects (C and D), and plane-wave trains (E and F). Relevant bifurcation points are labeled as in Fig. 2C. Note how spatiotemporal patterns exhibit a higher biomass density than the homogeneous periodic oscillations (black dots vs. blue dashed line) and persist beyond the tipping point of homogeneous solutions, SL and SN, indicating enhanced resilience. A fast-forward simulation of the entire transition is available in Movie S1. Movies with detailed temporal resolution of the dynamics in Insets (AF) are provided in Movies S2–S7, respectively.

References

    1. Lefever R., Lejeune O., On the origin of tiger bush. Bull. Math. Biol. 59, 263–294 (1997).
    1. Rietkerk M., et al. , Evasion of tipping in complex systems through spatial pattern formation. Science 374, eabj0359 (2021). - PubMed
    1. Siero E., et al. , Striped pattern selection by advective reaction-diffusion systems: Resilience of banded vegetation on slopes. Chaos 25, 036411 (2015). - PubMed
    1. Bastiaansen R., et al. , Multistability of model and real dryland ecosystems through spatial self-organization. Proc. Natl. Acad. Sci. U.S.A. 115, 11256–11261 (2018). - PMC - PubMed
    1. Bastiaansen R., Doelman A., Eppinga M. B., Rietkerk M., The effect of climate change on the resilience of ecosystems with adaptive spatial pattern formation. Ecol. Lett. 23, 414–429 (2020). - PMC - PubMed

LinkOut - more resources