The Mitochondria-Targeted Peptide Therapeutic Elamipretide Improves Cardiac and Skeletal Muscle Function During Aging Without Detectable Changes in Tissue Epigenetic or Transcriptomic Age
- PMID: 40080911
- PMCID: PMC12151887
- DOI: 10.1111/acel.70026
The Mitochondria-Targeted Peptide Therapeutic Elamipretide Improves Cardiac and Skeletal Muscle Function During Aging Without Detectable Changes in Tissue Epigenetic or Transcriptomic Age
Abstract
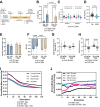
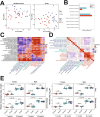
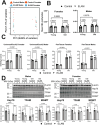
Aging-related decreases in cardiac and skeletal muscle function are strongly associated with various comorbidities. Elamipretide (ELAM), a novel mitochondria-targeted peptide, has demonstrated broad therapeutic efficacy in ameliorating disease conditions associated with mitochondrial dysfunction across both clinical and pre-clinical models. Herein, we investigated the impact of 8-week ELAM treatment on pre- and post-measures of C57BL/6J mice frailty, skeletal muscle, and cardiac muscle function, coupled with post-treatment assessments of biological age and affected molecular pathways. We found that health status, as measured by frailty index, cardiac strain, diastolic function, and skeletal muscle force, is significantly diminished with age, with skeletal muscle force changing in a sex-dependent manner. Conversely, ELAM mitigated frailty accumulation and was able to partially reverse these declines, as evidenced by treatment-induced increases in cardiac strain and muscle fatigue resistance. Despite these improvements, we did not detect statistically significant changes in gene expression or DNA methylation profiles indicative of molecular reorganization or reduced biological age in most ELAM-treated groups. However, pathway analyses revealed that ELAM treatment showed pro-longevity shifts in gene expression, such as upregulation of genes involved in fatty acid metabolism, mitochondrial translation, and oxidative phosphorylation, and downregulation of inflammation. Together, these results indicate that ELAM treatment is effective at mitigating signs of sarcopenia and cardiac dysfunction in an aging mouse model, but that these functional improvements occur independently of detectable changes in epigenetic and transcriptomic age. Thus, some age-related changes in function may be uncoupled from changes in molecular biological age.
Keywords: aging; aging biomarkers; cardiac dysfunction; elamipretide; epigenetic clocks; mitochondria; transcriptomic clocks.
© 2025 The Author(s). Aging Cell published by Anatomical Society and John Wiley & Sons Ltd.
Conflict of interest statement
Dr. David J. Marcinek has been a paid scientific advisor for and received elamipretide from Stealth Biotherapeutics at no charge. Stealth Biotherapeutics had no role in the support, design, or reporting of this study. The other authors declare no conflicts of interest.
Figures


Update of
-
The mitochondrial-targeted peptide therapeutic elamipretide improves cardiac and skeletal muscle function during aging without detectable changes in tissue epigenetic or transcriptomic age.bioRxiv [Preprint]. 2024 Oct 31:2024.10.30.620676. doi: 10.1101/2024.10.30.620676. bioRxiv. 2024. Update in: Aging Cell. 2025 Jun;24(6):e70026. doi: 10.1111/acel.70026. PMID: 39554099 Free PMC article. Updated. Preprint.
Similar articles
-
The mitochondrial-targeted peptide therapeutic elamipretide improves cardiac and skeletal muscle function during aging without detectable changes in tissue epigenetic or transcriptomic age.bioRxiv [Preprint]. 2024 Oct 31:2024.10.30.620676. doi: 10.1101/2024.10.30.620676. bioRxiv. 2024. Update in: Aging Cell. 2025 Jun;24(6):e70026. doi: 10.1111/acel.70026. PMID: 39554099 Free PMC article. Updated. Preprint.
-
The Black Book of Psychotropic Dosing and Monitoring.Psychopharmacol Bull. 2024 Jul 8;54(3):8-59. Psychopharmacol Bull. 2024. PMID: 38993656 Free PMC article. Review.
-
Systemic pharmacological treatments for chronic plaque psoriasis: a network meta-analysis.Cochrane Database Syst Rev. 2021 Apr 19;4(4):CD011535. doi: 10.1002/14651858.CD011535.pub4. Cochrane Database Syst Rev. 2021. Update in: Cochrane Database Syst Rev. 2022 May 23;5:CD011535. doi: 10.1002/14651858.CD011535.pub5. PMID: 33871055 Free PMC article. Updated.
-
Systemic pharmacological treatments for chronic plaque psoriasis: a network meta-analysis.Cochrane Database Syst Rev. 2017 Dec 22;12(12):CD011535. doi: 10.1002/14651858.CD011535.pub2. Cochrane Database Syst Rev. 2017. Update in: Cochrane Database Syst Rev. 2020 Jan 9;1:CD011535. doi: 10.1002/14651858.CD011535.pub3. PMID: 29271481 Free PMC article. Updated.
-
Signs and symptoms to determine if a patient presenting in primary care or hospital outpatient settings has COVID-19.Cochrane Database Syst Rev. 2022 May 20;5(5):CD013665. doi: 10.1002/14651858.CD013665.pub3. Cochrane Database Syst Rev. 2022. PMID: 35593186 Free PMC article.
Cited by
-
In vivo chemical reprogramming is associated with a toxic accumulation of lipid droplets hindering rejuvenation.bioRxiv [Preprint]. 2025 Jun 27:2025.06.25.661123. doi: 10.1101/2025.06.25.661123. bioRxiv. 2025. PMID: 40667171 Free PMC article. Preprint.
-
Mitochondrial Dysfunction Drives Age-Related Degeneration of the Thoracic Aorta.bioRxiv [Preprint]. 2025 Jun 15:2025.06.13.659620. doi: 10.1101/2025.06.13.659620. bioRxiv. 2025. PMID: 40661483 Free PMC article. Preprint.
-
Targeted Redox Regulation α-Ketoglutarate Dehydrogenase Complex for the Treatment of Human Diseases.Cells. 2025 Apr 29;14(9):653. doi: 10.3390/cells14090653. Cells. 2025. PMID: 40358176 Free PMC article. Review.
References
-
- Biering‐Sorensen, T. , Biering‐Sørensen S. R., Olsen F. J., Sengeløv M., Shah A., and Jensen J.. 2016. “Global Longitudinal Strain by Echocardiography Predicts Long Term Risk of Cardiovascular Morbidity and Mortality in A Low Risk General Population: The Copenhagen City Heart Study.” Journal of the American College of Cardiology 67, no. 13_Supplement: 1584. 10.1016/S0735-1097(16)31585-6. - DOI
MeSH terms
Substances
Grants and funding
LinkOut - more resources
Full Text Sources
Medical

