. 2025 Jun;23(6):2110-2124.
doi: 10.1111/pbi.70014. Epub 2025 Mar 13.

Multi-omics analysis of the regulatory network in winter buds of 'Cabernet Sauvignon' grapevine from dormancy to bud break

Affiliations

Multi-omics analysis of the regulatory network in winter buds of 'Cabernet Sauvignon' grapevine from dormancy to bud break

Li Chen et al. Plant Biotechnol J. 2025 Jun.

Abstract

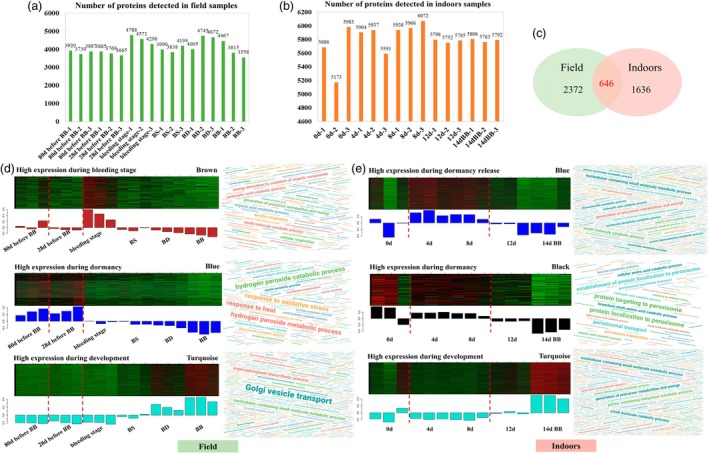
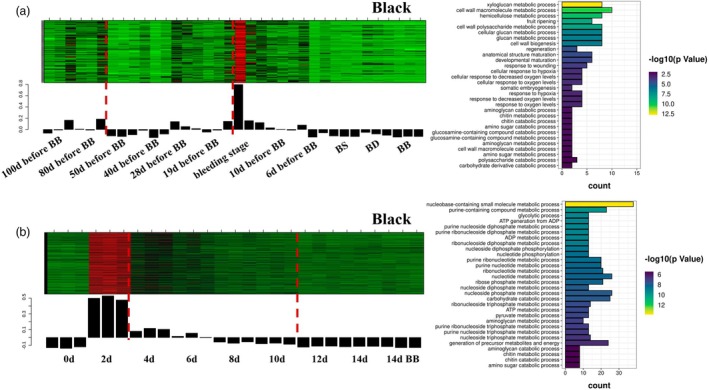
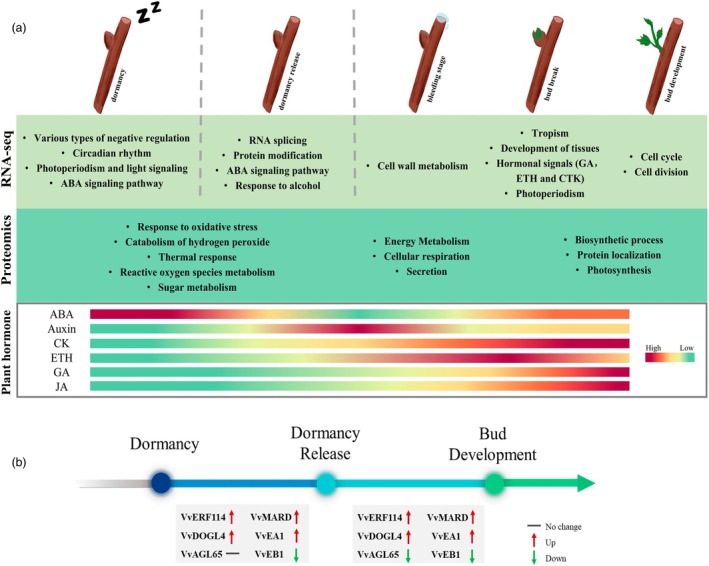
Winter dormancy and bud break are crucial to the viability, adaptability and yield of fruit trees, but not all metabolic activities or regulatory factors involved in maintaining and breaking dormancy are known. Here, winter buds, spanning from natural dormancy to bud break, were collected from 'Cabernet Sauvignon' grapevines maintained outdoors or forced indoors. The transcriptomes, proteomes and plant hormone contents were analysed across several bud stages. The winter buds presented three main stages, dormancy, dormancy release and bud development, whether grown in or outdoors. Weighted Correlation Network Analysis (WGCNA) and Gene Ontology (GO) analysis of the omics data revealed that the different stages were enriched for different biological processes. Analysis of the differentially expressed genes (DEGs) identified seven candidate genes that may affect grape dormancy and bud break. Transient transformation of these seven genes showed that VvDOGL4, VvAGL65 and VvMARD could promote maintenance of winter bud dormancy in grapevine. Subcellular localization showed that these three proteins all located to the nucleus, and yeast two-hybrid screening showed that they may interact with proteins related to plant hormone signal transduction, respiration, energy metabolism and transcription regulation to affect winter bud break in grapevine. Overall, these findings contribute to a better understanding of the regulatory dynamics of bud dormancy in a perennial fruit crop and lay a foundation for exploring key genes and regulatory mechanisms that can be manipulated to improve fruit quality and yields as the global climate shifts growing regions.

Keywords: Vitis vinifera L; dormant bud; phytohormone; regulatory network; transcriptome.


Figures

Figure 1
Figure 1
Transition from dormancy to activity of grape winter buds. (a) Internal tissues of winter buds. (b) Winter buds and their surrounding tissues were taken for various omics tests. (c) Indoor samples were branches removed from field‐grown grapevines and taken indoor for transition from dormancy. Buds were collected every 2 days from day 0 (day the branch was removed) to bud break over 14 days. The figure shows samples of 0, 6, 12 days and bud break (BB). (d) Winter bud development in field conditions, i: front and side views of winter buds at five times: 65 days before BB, 7 days before BB, bud swell (BS), bud downy (BD) and BB, other sampling times are not shown since there were no obvious changes in the appearance of winter buds between those periods; ii, iii: transverse and lateral views of field‐grown winter buds of the 10 groups of samples. (e‐h) Statistical analyses of transcriptome data derived from indoor (e and f) and outdoor (g and h) samples. Pearson correlation coefficient plots between (e) 27 indoor samples and (g) 36 field samples. The highly correlated sample sets indicate the three stages of winter bud dormancy, as indicated by dotted lines. Principal component analysis (PCA) between the indoor and field samples, with the three colour blocks representing the three stages of winter bud dormancy.
Figure 2
Figure 2
GO enrichment analyses of processes that change between the stages of dormancy at the transcriptional level. (a–c) The modules from the field and indoor transcriptomes are divided for putative promotion of bud break, bud growth and development and bud dormancy, respectively. The top half of each panel shows the clustered heatmap of the genes within the module, with high expression in red and low expression in green; the bottom half shows the expression pattern of the module eigenvalues in different samples. The word cloud on the right shows the results of the differential gene GO enrichment analysis, based on significantly enriched Biological Process items with the value of p < 0.05, with larger font size indicating more significant changes. Red dashed lines are used to indicate the time points of the three stages of bud dormancy. (d) Number of DEGs shared between the transcriptome modules. The mini‐bar plot in each column and row head shows the expression patterns of genes in this module. The numbers in brackets are the number of DEGs in this module, and the numbers in the table are the number of shared DEGs between the module pairs.
Figure 3
Figure 3
Proteomics of winter buds in grapes from dormancy to bud break. (a and b) The number of proteins detected in the proteome of each sample from the field (a) and from indoors (b), respectively. (c) Venn diagram of the number of proteins showing significantly different levels between field and indoor samples. (d and e) Some of the modules obtained from WGCNA of field and indoor proteome datasets, respectively. The top half of each panel shows the clustering heatmap of proteins within the module, with high expression in red and low expression in green; the bottom bar chart shows the expression patterns of module eigenvalues in different samples. The word cloud to the right shows the results of the differential protein GO enrichment analysis, made by selecting BP items that were significantly enriched with a p < 0.05 within the results, with the larger font size indicating more significant enrichment. Red dashed lines indicate the three stages of bud dormancy in the bar chart.
Figure 4
Figure 4
Changes in plant hormone content and signal transduction pathway gene expression. (a and c) Heat maps of hormone content in field (a) and indoor (c) samples, respectively. The three stages of bud dormancy are divided by black dashed lines. (b and d) Heat maps of hormone signal transduction pathway‐related gene expression in field (b) and indoor (d) samples, respectively. Selected genes were identified using KEGG pathway analysis. The three stages of bud dormancy are outlined in the heat map beneath the gene expression profile using red dashed lines.
Figure 5
Figure 5
Candidate gene functional verification. (a and b) Transient silencing and overexpression of seven candidate genes in winter buds of ‘Cabernet Sauvignon’, respectively. (c and d) Transcript levels of targeted genes in the transiently silenced (c) and overexpressing (d) winter buds, respectively. (e) Subcellular localization of VvMARD, VvDOGL4 and AGL65 proteins in tobacco leaves transiently expressing the mentioned proteins fused to GFP.
Figure 6
Figure 6
Unique transcriptome modules from field and indoor buds. (a) A module of genes that are highly expressed only during the bleeding period in the field transcriptome and (b) a module that is highly expressed only 2 days after relocation to the indoors. The histograms on the right show the top 30 terms significantly enriched under BP ontology obtained from GO enrichment analyses. The colour indicates significance, and the length of the column indicates the number of genes enriched under this term.
Figure 7
Figure 7
Multi‐omics analysis of the regulatory network of grapevine winter buds from dormancy to bud break. (a) Changes in the transcriptome, proteome and plant hormone levels in winter buds from dormancy to bud break in grapevines (Vitis vinifera L. ‘Cabernet Sauvignon’). The red and green bars indicate the level of the corresponding plant hormone, with the content gradually decreasing from red to green. The three stages of bud dormancy are divided by dotted lines. (b) Schematic representation of the changes in expression of the six candidate genes investigated in this study during the three stages of bud dormancy to bud break in winter buds.

References

    1. Azeez, A. , Zhao, Y.C. , Singh, R.K. , Yordanov, Y.S. , Dash, M. , Miskolczi, P. , Stojkovic, K. et al. (2021) EARLY BUD‐BREAK 1 and EARLY BUD‐BREAK 3 control resumption of poplar growth after winter dormancy. Nat. Commun. 12, 1123. - PMC - PubMed
    1. Baba, K. , Karlberg, A. , Schmidt, J. , Schrader, J. , Hvidsten, T.R. , Bako, L. and Bhalerao, R.P. (2011) Activity‐dormancy transition in the cambial meristem involves stage‐specific modulation of auxin response in hybrid aspen. Proc. Natl. Acad. Sci. U. S. A. 108, 3418–3423. - PMC - PubMed
    1. Beauvieux, R. , Wenden, B. and Dirlewanger, E. (2018) Bud dormancy in perennial fruit tree species: a pivotal role for oxidative cues. Front. Plant Sci. 9, 657. - PMC - PubMed
    1. Bogamuwa, S. and Jang, J. (2016) Plant tandem CCCH zinc finger proteins interact with ABA, drought, and stress response regulators in processing‐bodies and stress granules. PLoS One 11(3), e0151574. - PMC - PubMed
    1. Carrillo‐Barral, N. , Rodriguez‐Gacio, M.D.C. and Matilla, A.J. (2020) Delay of germination‐1 (DOG1): a key to understanding seed dormancy. Plants (Basel). 9, 480. - PMC - PubMed

LinkOut - more resources