. 2025 Mar 13;13(3):e010140.
doi: 10.1136/jitc-2024-010140.

Leveraging T cell co-stimulation for enhanced therapeutic efficacy of trispecific antibodies targeting prostate cancer

Affiliations

Leveraging T cell co-stimulation for enhanced therapeutic efficacy of trispecific antibodies targeting prostate cancer

Yanping Sun et al. J Immunother Cancer. .

Erratum in

Abstract

Background: Clinical trials have demonstrated the efficacy of bispecific antibodies in eliciting potent antitumor responses by redirecting T cells to target cancer cells, particularly for the treatment of hematologic malignancies. However, their efficacy against solid tumors is limited by intratumoral T-cell dysfunction and inadequate persistence. The co-stimulatory domains of 4-1BB, OX40, and CD28 are most widely used in engineering chimeric antigen receptor T-cells to augment T-cell responses.

Methods: In this study, we designed three co-stimulatory trispecific T cell-engaging antibodies (TriTCEs) that target Prostate-specific membrane antigen, CD3, and an additional co-stimulatory receptor(OX40, 4-1BB, or CD28). We conducted comparative profiling of the attributes of distinct co-stimulatory signals to T-cell functions in prostate cancer models.

Results: Co-stimulatory trispecific T-cell engagers enhance T-cell activation, proliferation, and display tumor cell-killing activity in vitro. These trispecific antibodies further boosted antitumor activity in humanized mouse xenograft models and increased the infiltration of CD45+ immune cells into solid tumors. Specifically, TriTCE-4-1BB and TriTCE-CD28 selectively promoted the expansion of effector memory T cells and increased the presence of CD4+ T cells more than TriTCE-OX40. T cells stimulated with TriTCE-4-1BB exhibited reduced exhaustion. Furthermore, T cells treated with co-stimulatory trispecific antibodies demonstrated enhanced metabolic activity characterized by increased oxidative phosphorylation and elevated glycolysis.

Conclusions: Collectively, incorporating co-stimulatory receptor targeting domains represents a potentially effective strategy to unlock the full therapeutic potential of T-cell-engaging antibodies for the treatment of solid tumors.

Keywords: Antibody; Immunotherapy; co-stimulatory molecules.


Conflict of interest statement

Competing interests: No, there are no competing interests.

Figures
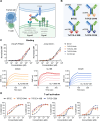
Figure 1
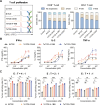
Figure 1. Schematic design of co-stimulatory TriTCEs. (A) Schematic representation of T cells targeting tumor cells via co-stimulatory T-cell-engaging antibody, initiating antitumor immune responses. (B) Schematic diagram showing the bispecific antibody and trispecific antibodies constructed for this study (blue, anti-human PSMA Fab; green, anti-human CD3 Fab; orange, anti-human OX40 single-chain variable fragment (scFv); red, anti-human 4-1BB scFv; purple, anti-human CD28 scFv). (C) Top: Flow cytometric analysis of antibody binding to the PSMA-expressing tumor cell line (LNCaP) and CD3-expressing cell line (Jurkat) (n=3). Bottom: Determination of binding affinities of TriTCE-OX40 to human OX40, TriTCE-4-1BB to human 4-1BB, and TriTCE-CD28 to human CD28 using BLI. KD values (equilibrium dissociation constants) are indicated (n=3). (D) CD69 and CD25 upregulation were assessed on CD8+ and CD4+ T cells by flow cytometry in co-cultures of human PBMCs and LNCaP (PSMA positive) target tumor cells in a 4:1 ratio in the presence of increasing concentrations of BiTCE, TriTCE-OX40, TriTCE-4-1BB, and TriTCE-CD28 for 48 hours (n=3). Data are representative of three independent experiments. BLI, bio-layer interferometry; PSMA, prostate-specific membrane antigen; TriTCEs, trispecific T cell-engaging antibodies.
Figure 2
Figure 2. Costimulatory TriTCEs enhance T-cell proliferation, cytokine secretion, and tumor cell cytotoxicity in vitro. (A) Proliferation of CFSE-labeled CD8+ and CD4+ T cells was evaluated following co-culture with PBMCs and LNCaP cells in the presence of 1 nM antibody for 72 hours (effector:target (E:T) ratio of 4:1). (B) IFN-γ, IL-2, and TNF-α production were measured by ELISA in culture supernatants from incubation of PBMC and LNCaP cells in a 4:1 ratio treated with increasing concentrations of BiTCE, TriTCE-OX40, TriTCE-4-1BB, and TriTCE-CD28 for 48 hours. (C) Cytolysis of the PSMA+ tumor cell line LNCaP with trispecific antibodies and the bispecific control was assessed using the cytotoxicity LDH assay kit in vitro at effector:target ratio of 4:1, 2:1, 1:1. Data show mean±SD (n=3 independent experiments each) and were analyzed by one-way ANOVA with Dunnett’s post-test analysis. *p<0.05; **p<0.01; ***p<0.001; ****p<0.0001; ns, no significance compared with the bispecific control. ANOVA, analysis of variance; PBMCs, peripheral blood mononuclear cells; TriTCEs, trispecific T cell-engaging antibodies; LDH, lactate dehydrogenase; CFSE, carboxyfluorescein succinimidyl ester.
Figure 3
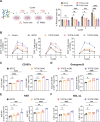
Figure 3. T-cells treated with co-stimulatory TriTCEs show sustained antitumor efficacy under repeated tumor stimulation. (A) Schema of the multi-round co-culture experiment (left). At cycle 1, peripheral blood mononuclear cells (PBMCs) were added to the tumor cell-seeded plate at E:T (effector:target ratio) of 4:1 with 1 nM BiTCE, TriTCE-OX40, TriTCE-4-1BB, and TriTCE-CD28, respectively. At cycles 2, 3, and 4, new tumor cells were added to the plate. Count tumor cells and T cells by flow cytometry after each cycle. Quantification of residual live tumor cell ratio (gated as FITC+ cells) in the co-culture experiments (right). (B) Count numbers of CD8+ and CD4+ T cells in the co-culture experiments. (C) The expression of CD107a in CD8+ and CD4+ T cells in the final round of the long-term co-culture experiment. (D, E) Mean fluorescence intensity (MFI) of Granzyme B (D) secreted by CD8+ and CD4+ T cells and Ki67 (E) in CD8+ and CD4+ T cells in the final round of the long-term coculture experiment. (F) The percentage of BCL-xL, an anti-apoptotic BCL-2 family member, was measured in CD8+ and CD4+ T cells in the final round of the long-term coculture experiment. Data are representative of two multiround co-culture experiments. Data are shown as individual values and mean±SD. Data were analyzed by one-way ANOVA with Dunnett’s post-test analysis. *p<0.05; **p<0.01; ***p<0.001; ****p<0.0001; ns, no significance compared with the bispecific control. ANOVA, analysis of variance; TriTCEs, trispecific T cell-engaging antibodies.
Figure 4
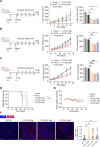
Figure 4. Co-stimulatory TriTCEs inhibit tumor progression in NCG mouse xenograft models. (A) Schematic diagram of the experimental design. NCG mice (NOD/ShiLtJGpt-Prkdcem26Cd52Il2rgem26Cd22/Gpt) were engrafted with 5×10⁶ 22Rv1 tumor cells to establish the prostate xenograft model (n=5 mice per group). 7×10⁶ human PBMCs were inoculated, and every 3 days antibody treatment began when the average tumor volume was ~60 mm3. Tumor burden was quantified at various time points. (B) Tumor growth inhibition was evaluated in advanced 22Rv1 tumor-bearing mice. Treatment began when the average tumor volume was ~200 mm3 (n=5 mice per group). (C) Tumor growth inhibition was evaluated in 22Rv1 tumor-bearing mice using CD3+ T cells as effector cells (n=5 mice per group). (D) Overall survival curves of advanced tumor-bearing mice following antibody treatment therapy. (E) Representative body weight variation of different treatment groups. (F) Tumors were collected at the end of the study, and immunofluorescence was performed for human CD45+ cells. Representative images for each treatment group and quantification of positively stained cells are shown. Scale bars represent 50 µm. Data show mean±SD and were analyzed by two-way ANOVA with Dunnett’s post-test analysis. (A–C) or unpaired, two-tailed Student’s t-test (F). Differences between survival curves (D) were analyzed by log-rank test. *p<0.05; **p<0.01; ***p<0.001; ns, no significance compared with the bispecific control. ANOVA, analysis of variance; TriTCEs, trispecific T cell-engaging antibodies.
Figure 5
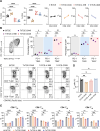
Figure 5. Distinct T-cell phenotype treated with co-stimulatory TriTCEs on tumor antigen stimulation. (A) CD8+ and CD4+ T-cell ratios in different treatment groups in the coculture assays after 48 hours were analyzed by flow cytometry (gated on CD3+ T cells). (B) The expression of T-cell exhaustion marker PD-1 and TIM-3 in T cells after incubation with tumor cells and either BiTCE, TriTCE-OX40, TriTCE-4-1BB, or TriTCE-CD28. (C, E) Representative flow cytometry plots of cell-surface expression of CCR7 and CD45RO (C) and quantitative results (E) showing the frequencies of central memory T-cell (TCM) and effector memory T-cell (TEM). (D) Percentage of CD4CD25Foxp3 Tregs in different treatment groups in the coculture assays were analyzed by flow cytometry. Data show individual values and mean±SD (n=3 independent experiments each). Statistical significance was measured by one-way ANOVA with Dunnett’s post-test analysis. *p<0.05; **p<0.01; ***p<0.001; ****p<0.0001; ns, no significance compared with the bispecific control. ANOVA, analysis of variance; TriTCEs, trispecific T cell-engaging antibodies.
Figure 6
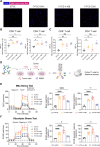
Figure 6. Co-stimulatory TriTCEs promote T-cell metabolic activities. (A) Representative confocal images stained with Mitotracker deep red (pink) and DAPI (blue). Scale bars represent 10 µm. (B, C) Mitochondrial mass (B) and mitochondrial membrane potential (C) of CD8+ and CD4+ T cells in different treatment groups in the coculture assays analyzed by flow cytometry. (D) Schematic diagram of the Seahorse experimental design. At day 1, peripheral blood mononuclear cells (PBMCs) were added to the tumor cell-seeded plate at E:T (effector:target ratio) of 4:1 with 1 nM BiTCE, TriTCE-OX40, TriTCE-4-1BB, and TriTCE-CD28, respectively. At days 4 and 7, new tumor cells were added to the plate. At day 9, CD3+ T cells were sorted and collected for Seahorse assays by flow cytometry after three rounds of co-culture experiment. (E, F) Metabolic profile showing O2 (E) and glucose consumption (F) of CD3+ T cells in different treatment groups after three rounds of co-culture experiment (n=6 samples). O2 consumption rate and extracellular acidification rate were assessed at different time points in a Seahorse XF-96 analyzer. n=2 independent experiments. Summarized data on the right display basal oxygen consumption rate (OCR), maximal OCR, extracellular acidification rate (ECAR) glycolysis, and ECAR glycolysis capacity of sorted CD3+ T cells. Data show mean±SD and were analyzed by one-way ANOVA with Dunnett’s post-test analysis. *p<0.05; **p<0.01; ***p<0.001; ****p<0.0001; ns, no significance compared with the bispecific control. ANOVA, analysis of variance; TriTCEs, trispecific T cell-engaging antibodies.
Figure 7
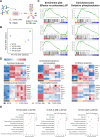
Figure 7. Transcriptional profiling of T cells co-cultured with distinct co-stimulatory TriTCEs. (A) Schematic diagram of the sample preparation for RNA-seq. Peripheral blood mononuclear cells (PBMCs) were co-cultured with tumor cells and were stimulated with 1 nM BiTCE, TriTCE-OX40, TriTCE-4-1BB, and TriTCE-CD28, respectively. CD3+ T cells were sorted and collected for RNA-seq at day 5. (B) Principal component analysis of transcriptome data from sorted CD3+ T cells in different treatment groups. (C) GSEA of the effector versus exhausted UP and oxidative phosphorylation pathway genes in T cells treated with bispecific and trispecific antibodies. (D) Heat map illustrating the relative expression of genes in sorted T cells in different treatment groups from the co-culture assay. (E) Enrichment analysis of gene sets in T cells after treatment with TriTCE-OX40, TriTCE-4-1BB, and TriTCE-CD28 compared with the bispecific control is shown.

References

    1. Cappell KM, Kochenderfer JN. Long-term outcomes following CAR T cell therapy: what we know so far. Nat Rev Clin Oncol. 2023;20:359–71. doi: 10.1038/s41571-023-00754-1. - DOI - PMC - PubMed
    1. Sharma P, Goswami S, Raychaudhuri D, et al. Immune checkpoint therapy-current perspectives and future directions. Cell. 2023;186:1652–69. doi: 10.1016/j.cell.2023.03.006. - DOI - PubMed
    1. Stultz J, Fong L. How to turn up the heat on the cold immune microenvironment of metastatic prostate cancer. Prostate Cancer Prostatic Dis. 2021;24:697–717. doi: 10.1038/s41391-021-00340-5. - DOI - PMC - PubMed
    1. Goebeler ME, Bargou RC. T cell-engaging therapies - BiTEs and beyond. Nat Rev Clin Oncol. 2020;17:418–34. doi: 10.1038/s41571-020-0347-5. - DOI - PubMed
    1. Hou AJ, Chen LC, Chen YY. Navigating CAR-T cells through the solid-tumour microenvironment. Nat Rev Drug Discov. 2021;20:531–50. doi: 10.1038/s41573-021-00189-2. - DOI - PubMed