. 2025 Mar 13;16(1):2493.
doi: 10.1038/s41467-025-57551-w.

Placenta-derived factors contribute to human iPSC-liver organoid growth

Affiliations

Placenta-derived factors contribute to human iPSC-liver organoid growth

Yoshiki Kuse et al. Nat Commun. .

Abstract

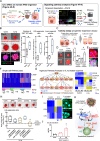
Organoids derived from human induced pluripotent stem cells (hiPSC) are potentially applicable for regenerative medicine. However, the applications have been hampered by limited organoid size and function as a consequence of a lack of progenitor expansion. Here, we report the recapitulation of progenitor expansion in hiPSC-liver organoids based on the analysis of mouse development. Visualization of blood perfusion and oxygen levels in mouse embryos reveals a transient hypoxic environment during hepatoblast expansion, despite active blood flow. During this specific stage, the placenta expresses various growth factors. Human and mouse placenta-liver interaction analysis identifies various placenta-derived factors. Among them, IL1α efficiently induces the growth in hiPSC-liver organoids as well as mouse fetal livers following progenitor expansion under hypoxia. Furthermore, subsequent oxygenation demonstrates that progenitors expanded by IL1α contribute to hiPSC-liver organoid size and function. Taken together, we demonstrate that treatment with the placenta-derived factor under hypoxia is a crucial human organoid culture technique that efficiently induces progenitor expansion.


Conflict of interest statement

Competing interests: The authors declare no competing interests.

Figures

Fig. 1
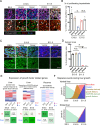
Fig. 1. Localized perfusion promotes the growth of the liver ventral lobe between E10.5 and E11.5.
A Illustration of the method for visualizing placenta-derived perfused vessels using CD31 antibodies (Ab). B Confirmation of intravital CD31 Ab perfusion (gray). Scale bar = 1 mm. C Confirmation of CD31 Ab perfusion into the liver tissue sections. Images indicate perfused CD31 (gray) and HNF4α (magenta). Scale bar = 500 μm or 100 μm. D Whole-mount imaging of perfused CD31 (gray) and HNF4α (magenta) immunostaining at each stage. Perfused CD31 in the liver was visualized (green) using Imaris. Scale bar = 300 μm. E Visualization of the perfused blood vessels in the ventral and dorsal lobes of the liver (blue or gray). Scale bar = 200 μm. F Quantification of perfused blood vessels in the dorsal and ventral lobes of the liver at E10.5. Error bars are represented as SEM; Ventral (n = 3), Dorsal (n = 3), two-tailed Student’s t-test, Ventral vs. Dorsal (p-value = 0.0227). G Quantification of perfused blood vessels in the dorsal and ventral lobes of the liver at E11.5. Error bars are represented as SEM; Ventral (n = 3), Dorsal (n = 3), two-tailed Student’s t-test, Ventral vs. Dorsal (p-value = 0.4640). H Quantification of the volume of the dorsal and ventral lobes of the liver at E10.5 and E11.5. Error bars are represented as SEM; Ventral (n = 3), Dorsal (n = 3), One-way ANOVA with Tukey’s test, E10.5 ventral vs. E11.5 ventral (p-value = 0.001), E11.5 ventral versus E11.5 dorsal (p-value = 0.004). I Ventral liver growth between E10.5 and E11.5 followed by hepatoblast expansion induced by placenta-derived blood perfusion. Source data are provided as a Source Data file.
Fig. 2
Fig. 2. Hepatoblast expansion induced by placenta-derived blood perfusion under hypoxia.
A Images of perfused CD31 and HNF4α/EdU immunostaining in each stage. Scale bar = 50 μm. B Quantification of hepatoblast expansion by counting the number of HNF4α+EdU+ cells at each stage. Error bars are represented as SEM; E9.5 (n = 3), E10.5 Ventral (n = 5), E10.5 Dorsal (n = 4), E11.5 Ventral (n = 3), E11.5 Dorsal (n = 3), One-way ANOVA with Tukey’s test, E10.5 Ventral vs. E10.5 Dorsal (p-value = 0.002). E11.5 Ventral vs. E11.5 Dorsal (p-value = 0.9467). C Oxygen level in the liver at each stage. Pimonidazole indicated hypoxic regions (green). Scale bar = 50 μm. D Quantification of pimonidazole positive regions in the liver. Error bars are represented as SEM; E9.5 (n = 4), E10.5 Ventral (n = 3), E10.5 Dorsal (n = 3), E11.5 Ventral (n = 4), E11.5 Dorsal (n = 4), One-way ANOVA with Tukey’s test, E10.5 ventral versus E11.5 ventral (p-value < 0.0001). E10.5 dorsal versus E11.5 dorsal (p-value < 0.0001). E Microarray data of growth factor-related gene expression in placenta or liver. F Putative spatiotemporal interactions between liver and placenta. Placenta-derived blood containing factors perfuses into the ventral lobe of the liver. Source data are provided as a Source Data file.
Fig. 3
Fig. 3. Placenta-derived IL1α promotes hepatoblast expansion at E10.5.
A Schematic overview of placenta-liver interaction analysis. B KEGG pathway analysis using human and mouse placenta and liver microarray data. C Extraction of enriched genes in humans and mice, as shown in the Venn diagram. D Ligands and receptors with matched signaling using CellTalkDB. E Effect of placental ligands on fetal liver culture. Whole-mount staining three days after culture. P: Parenchyma. Scale bar = 500 μm or 100 μm. F Liver area calculated using macro-images during culture. Error bars are represented as SEM; Control (n = 8), FGF2 (n = 8), IL1α (n = 10), IL13 (n = 7), InhBB (n = 9), PDGFAB (n = 8), One-way ANOVA with Tukey’s test, IL1α versus Control (p-value = 0.0196). Liver volume calculated using whole-mount images. Error bars are represented as SEM; Control (n = 5), FGF2 (n = 5), IL1α (n = 4), IL13 (n = 3), InhBB (n =  5), PDGFAB (n = 4), two-tailed Mann–Whitney U-test, IL1α versus Control (p-value = 0.0159). Hepatoblast expansion calculated using whole-mount images. Error bars are represented as SEM; Control (n = 5), FGF2 (n = 5), IL1α (n = 4), IL13 (n = 3), InhBB (n = 5), PDGFAB (n = 4), two-tailed Mann–Whitney U-test, IL1α versus Control (p-value = 0.0159), InhBB versus Control (p-value = 0.0159). G IL1α production from isolated each tissue. Error bars are represented as SEM; Placenta (n = 6), Liver+STM (n = 4), Heart (n = 3), Fetus (n = 3), One-way ANOVA with Tukey’s test, Placenta versus each group (p-value < 0.0001). H Examination of IL1rap expression in the ventral and dorsal lobes of the liver using MOSTA. Error bars are represented as SEM; Ventral (n = 11), Dorsal (n = 6), two-tailed Mann–Whitney U-test, Ventral versus Dorsal (p-value = 0.0063). Scale bar = 500 μm or 100 μm. I Examination of IL1rap expression in the ventral and dorsal lobes of the liver using immunostaining. Scale bar = 100 μm. J E11.5 whole liver after IL1 receptor antagonist (IL1RA) treatment at E10.5. Scale bar = 100 μm. K Ratio of ventral/dorsal liver lobe after IL1RA treatment. Error bars are represented as SEM; Vehicle (n = 5), IL1RA (n = 6), two-tailed Mann–Whitney U-test, IL1RA versus Vehicle (p-value = 0.0043). L Hepatoblast expansion after IL1RA treatment. Error bars are represented as SEM; Vehicle (n = 5), IL1RA (n = 6), two-tailed Student’s t-test, IL1RA versus Vehicle (p-value = 0.0314). M Hepatoblast expansion occurs in the ventral liver lobe after perfusion with placenta-derived IL1α at E10.5. Source data are provided as a Source Data file.
Fig. 4
Fig. 4. IL1α promotes hiPSC-derived liver organoid growth.
A Schematic overview of hiPSC-liver organoid culture and subsequent analysis. B Effect of IL1α on hiPSC-liver organoid culture. KO (Kusabira–Orange) indicates hiPSC-hepatoblasts (KO-HE). Whole-mount staining three days after organoid culture. Scale bar = 500 μm or 100 μm. Quantification of liver volume using the HNF4α+ regions. Box plots show the minimum value to maximum value. Error bars are represented as SEM; Control (n = 4), IL1α (n = 4), two-tailed Mann–Whitney U-test, IL1α versus Control (p-value = 0.0286). C Colony assay using single or small cluster of cells derived from organoids with or without IL1α. D Ratio of HE colony areas with and without IL1α pre-treatment. Error bars are represented as SEM; Control small colonies (n = 3), IL1α small colonies (n = 4), Control large colonies (n = 3), IL1α large colonies (n = 4), One-way ANOVA with Tukey’s test, IL1α small colonies versus Control small colonies (p-value = 0.3600). IL1α large colonies versus Control large colonies (p-value = 0.0019). E The expression of ALB+CK19+ in IL1α pre-treated HE colony. Scale bar =  10 μm. F Expression of IL1 receptor related genes using single cell RNA-seq data set (Camp JG et al. Nature 2017). G Ingenuity Pathway Analysis (IPA) in organoid using RNAseq data. H Effects of inhibitors against each pathway estimated by IPA on HE expansion for 7 days. Box plots show the minimum value to maximum value. Error bars are represented as SEM; Control (n = 4), ZINC00784494 (n = 4), Linsitinib (n = 4), Compstatin (n = 4), CCR6 antagonist (n = 4), One-way ANOVA with Tukey’s test, CCR6 antagonist versus Control (p-value = 0.0219). Scale bar = 500 μm. I Gene expression of SAA1, CCR6 and TLR2 on HE, EC and MC. Immunostaining of CCR6 and TLR2. Scale bar = 10 μm. J CCL20 secretion from hiPSC-liver organoid after SAA1 treatment. Error bars are represented as SEM; Control (n = 4), SAA1 6 μg/mL (n = 4), SAA1 20 μg/mL (n = 4), One-way ANOVA with Tukey’s test, SAA1 20 μg/mL versus Control (p-value < 0.0001). K Estimated cell-cell interaction within hiPSC-liver organoid after IL1α treatment. Hepatoblast expands through IL1α-induced SAA1-TLR2-CCL20-CCR6 signaling. Source data are provided as a Source Data file.
Fig. 5
Fig. 5. Oxygen enhances IL1α-induced hiPSC-liver organoid growth.
A Culture protocol of hiPSC-liver organoid based on the analysis of liver development. B Effect of IL1α and oxygen (Oxy) on hiPSC-liver organoid. KO-HE was observed in 3D on day 14. Ki67 (green) and HNF4α (red) immunostaining using hiPSC-liver organoid tissue sections. Scale bar = 500 μm or 100 μm. C Quantification of hepatoblast proliferation indicated by HNF4α+Ki67+ on day 14. Box plots show the minimum value to maximum value. Error bars are represented as SEM; Control (n = 3), IL1α (n = 4), Oxy (n = 4), IL1α/Oxy (n = 4), One-way ANOVA with Tukey’s test, IL1α/Oxy versus Control (p-value = 0.0008), IL1α/Oxy versus IL1α (p-value = 0.0072), IL1α/Oxy versus Oxy (p-value = 0.0005). Quantification of hiPSC-liver organoid volume on day 14. Error bars are represented as SEM; Control (n = 6), IL1α (n = 6), Oxy (n = 4), IL1α/Oxy (n = 6), One-way ANOVA with Tukey’s test, IL1α/Oxy versus Control (p-value = 0.0002), IL1α/Oxy versus IL1α (p-value = 0.0010), IL1α/Oxy versus Oxy (p-value = 0.0437). D Quantification of hALB secretion from hiPSC-liver organoids over time. Box plots are shown the minimum value to maximum value. Error bars are represented as SEM; IL1α day1 (n = 4), IL1α/Oxy day1 (n = 4), IL1α day7 (n = 4), IL1α/Oxy day7 (n = 4), IL1α day14 (n = 4), IL1α/Oxy day14 (n = 4), two-tailed Student’s t-test, IL1α/Oxy day14 versus IL1α day14 (p-value = 0.0485). E Gene expressions of hepatocyte and hepatoblast markers on HE sorted from IL1α/Oxy-treated hiPSC-liver organoid. Source data are provided as a Source Data file.

References

    1. Takebe, T. et al. Vascularized and complex organ buds from diverse tissues via mesenchymal cell-driven condensation. Cell Stem Cell16, 556–565 (2015). - PubMed
    1. Takebe, T. et al. Vascularized and functional human liver from an iPSC-derived organ bud transplant. Nature499, 481–484 (2013). - PubMed
    1. Camp, J. G. et al. Multilineage communication regulates human liver bud development from pluripotency. Nature546, 533–538 (2017). - PubMed
    1. Amabile, G. & Meissner, A. Induced pluripotent stem cells: current progress and potential for regenerative medicine. Trends Mol. Med.15, 59–68 (2009). - PubMed
    1. Yamanaka, S. Pluripotent stem cell-based cell therapy—promise and challenges. Cell Stem Cell27, 523–531 (2020). - PubMed

Substances

LinkOut - more resources