

Sustainable groundwater management through water quality index and geochemical insights in Valsad India
- PMID: 40082503
- PMCID: PMC11907065
- DOI: 10.1038/s41598-025-92053-1
Sustainable groundwater management through water quality index and geochemical insights in Valsad India
Abstract
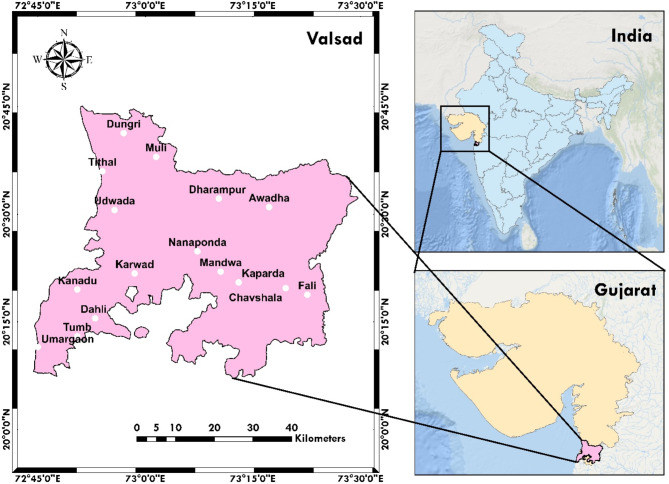
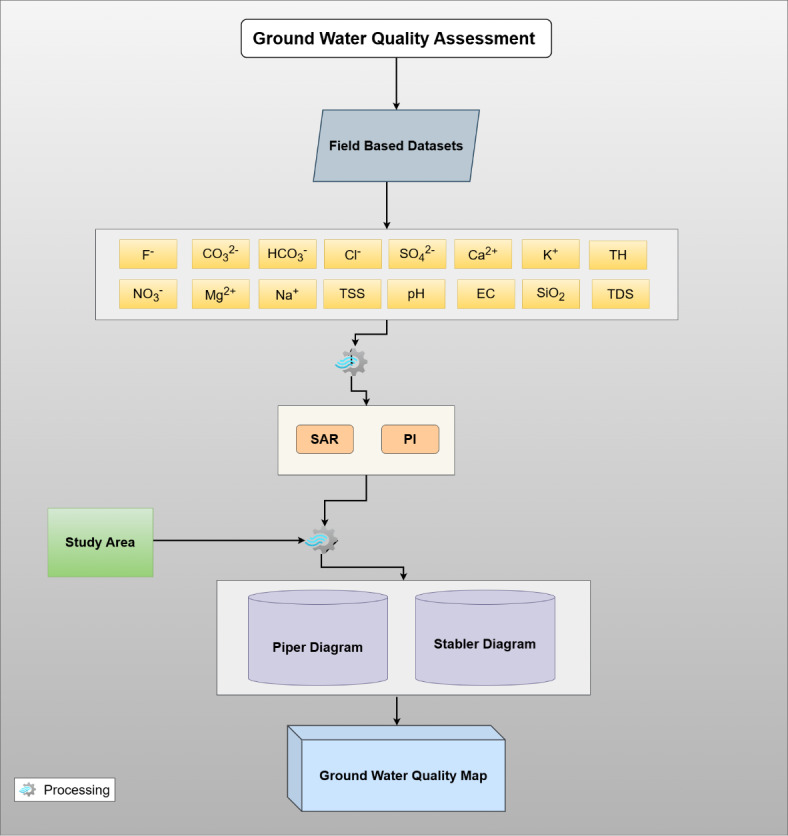
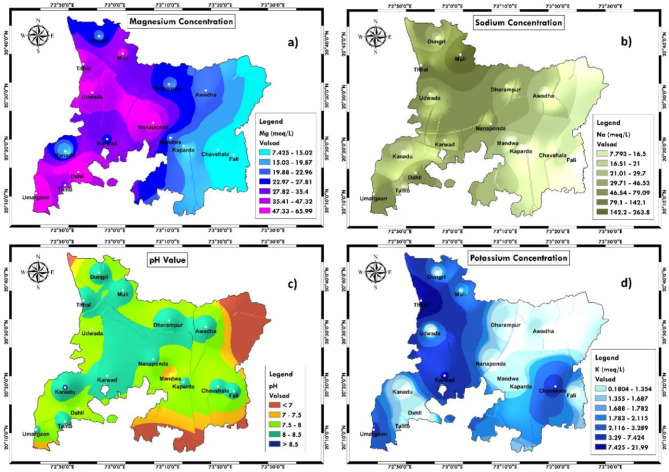
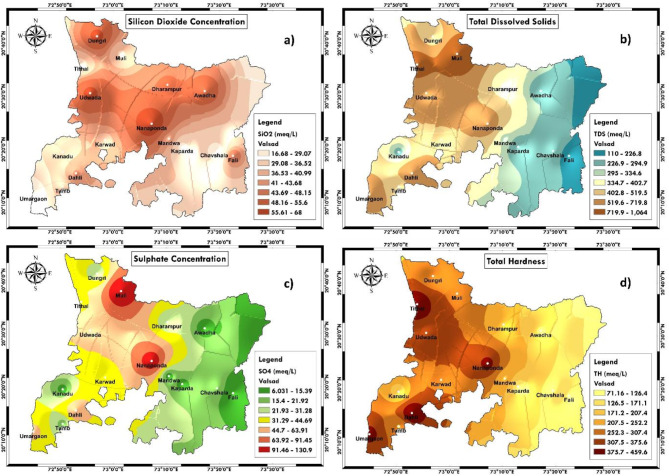
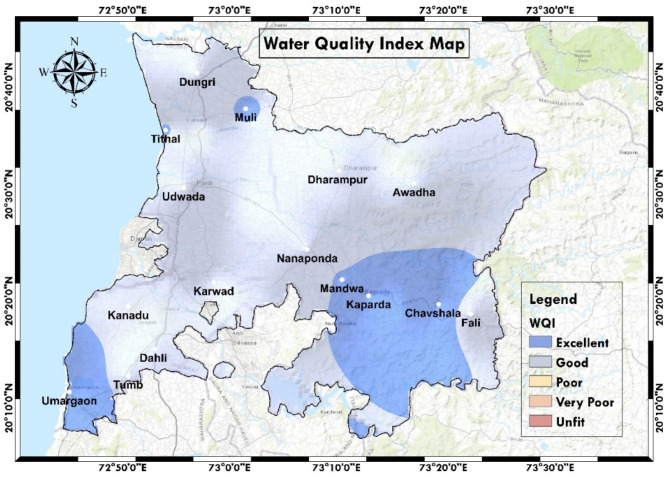
Groundwater quality assessment is crucial for sustainable water resource management and public health protection. This study evaluated the Water Quality Index (WQI) of groundwater in the southern part of Gujarat focusing on the Valsad District. Groundwater in this region occurs in porous, unconsolidated formations and fracture formations, both under groundwater table conditions and confined aquifers. Various parameters including Nitrate (NO3¯), pH, Calcium (Ca2+), Electrical Conductivity (EC), Total Hardness (TH), Magnesium (Mg2+), Total Dissolved Solids (TDS), Potassium (K+), Sodium (Na+), Sulphate (SO42-), Chloride (Cl¯), Bicarbonate (HCO3¯), Silicate (SiO44-), and Fluoride (F¯) were analyzed to assess groundwater quality. Results indicate that most of the parameters fell within acceptable permissible limits for drinking water, except for Muli and Nanaponda villages with the parameters Cl¯, EC, and TDS exceeding the permissible limit. The WQI analysis revealed that 31.25% of water samples from different villages were found in the excellent category (WQI < 25). About 68.75% of samples from 16 villages were classified as good quality category (WQI ∼ 25-50). Overall, the WQI ranged from 14.20 to 41.98, suggesting that groundwater in the Valsad district is suitable for drinking. The Piper diagram analysis of water samples collected from the field indicated unique geochemical compositions and good water. The diagram revealed that the Ca2+ was the predominant cation, followed by K+, Na+, and Mg2+. Among the anions, the HCO3- showed the highest concentrations, followed by SO42-, NO3-, and Cl-. This dominance pattern demonstrated that the weathering of minerals significantly influenced the groundwater. This study recommends remediation for areas with reduced water quality to address geogenic and anthropogenic contamination.
Keywords: Drinking suitability; GIS; Potentially toxic elements; Valsad; WQI.
© 2025. The Author(s).
Conflict of interest statement
Declarations. Competing interests: The authors declare no competing interests. Ethics approval and consent to participate: The authors followed the ethical guidelines and no ethical approval was required and all the authors agreed to participate. Consent for publication: All authors are agreeing to publish the content.
Figures


Similar articles
-
Hydrogeochemistry and groundwater quality assessment in Ambagarh Chowki, Chhattisgarh, India.Environ Monit Assess. 2022 Oct 27;195(1):43. doi: 10.1007/s10661-022-10650-3. Environ Monit Assess. 2022. PMID: 36301354
-
Water quality index and GIS-based technique for assessment of groundwater quality in Wanaparthy watershed, Telangana, India.Environ Sci Pollut Res Int. 2020 Dec;27(36):45041-45062. doi: 10.1007/s11356-020-10345-7. Epub 2020 Aug 10. Environ Sci Pollut Res Int. 2020. PMID: 32779065
-
Evaluation of water quality index and geochemical characteristics of surfacewater from Tawang India.Sci Rep. 2022 Jul 9;12(1):11698. doi: 10.1038/s41598-022-14760-3. Sci Rep. 2022. PMID: 35810170 Free PMC article.
-
Assessment of the impact of flood on groundwater hydrochemistry and its suitability for drinking and irrigation in the River Periyar Lower Basin, India.Environ Sci Pollut Res Int. 2022 Apr;29(19):28267-28306. doi: 10.1007/s11356-021-17596-y. Epub 2022 Jan 6. Environ Sci Pollut Res Int. 2022. PMID: 34988810
-
Major ion chemistry and suitability of groundwater resources for different utilizations in mica mining areas, Jharkhand, India.Geochem Trans. 2025 May 19;26(1):5. doi: 10.1186/s12932-025-00099-x. Geochem Trans. 2025. PMID: 40389614 Free PMC article.
Cited by
-
Integrated evaluation of groundwater hydrochemistry using multivariate statistics and irrigation-based water quality indices.Sci Rep. 2025 Jul 10;15(1):24923. doi: 10.1038/s41598-025-09874-3. Sci Rep. 2025. PMID: 40640306 Free PMC article.
-
A holistic methodology for evaluating flood vulnerability, generating flood risk map and conducting detailed flood inundation assessment.Sci Rep. 2025 Aug 2;15(1):28253. doi: 10.1038/s41598-025-13025-z. Sci Rep. 2025. PMID: 40753290 Free PMC article.
References
-
- Yisa, J. & Jimoh, T. Analytical studies on water quality index of river Landzu. Am. J. Appl. Sci.7, 453–458 (2010).
-
- Singh, K. P., Malik, A., Mohan, D. & Sinha, S. Multivariate statistical techniques for the evaluation of Spatial and Temporal variations in water quality of Gomti river (India)—a case study. Water Res.38, 3980–3992 (2004). - PubMed
-
- Kilic, E. & Yucel, N. Determination of Spatial and Temporal changes in water quality at Asi river using multivariate statistical techniques. Turk. J. Fish. Aquat. Sci.19, (2019).
-
- Wang, X., Cai, Q., Ye, L. & Qu, X. Evaluation of Spatial and Temporal variation in stream water quality by multivariate statistical techniques: A case study of the Xiangxi river basin, China. Quatern. Int.282, 137–144 (2012).
Grants and funding
LinkOut - more resources
Full Text Sources
Miscellaneous
