. 2025 Apr;22(4):801-812.
doi: 10.1038/s41592-025-02623-4. Epub 2025 Mar 13.

A systematic benchmark of Nanopore long-read RNA sequencing for transcript-level analysis in human cell lines

Collaborators, Affiliations

A systematic benchmark of Nanopore long-read RNA sequencing for transcript-level analysis in human cell lines

Ying Chen et al. Nat Methods. 2025 Apr.

Abstract

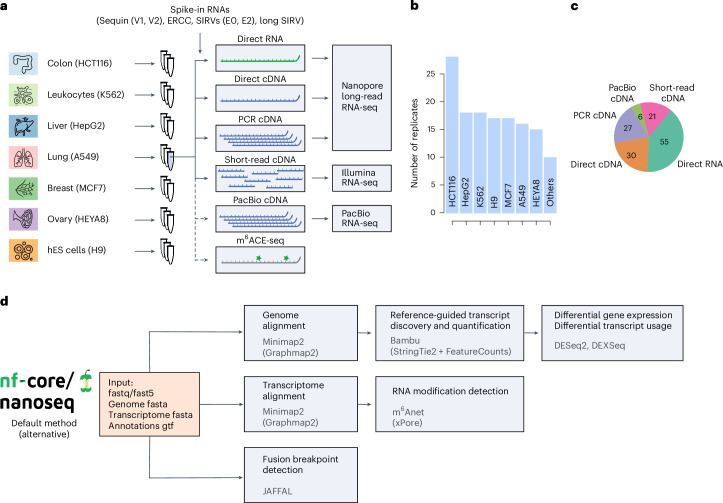
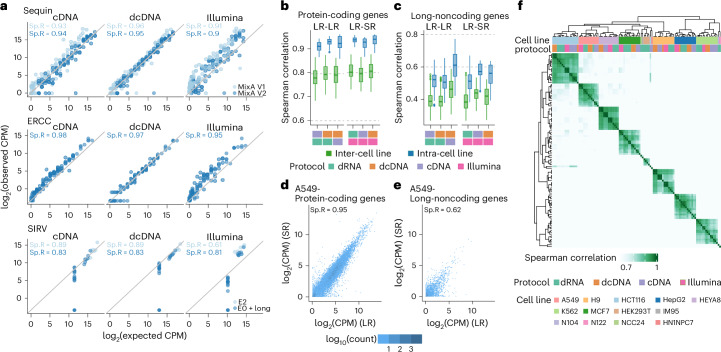
The human genome contains instructions to transcribe more than 200,000 RNAs. However, many RNA transcripts are generated from the same gene, resulting in alternative isoforms that are highly similar and that remain difficult to quantify. To evaluate the ability to study RNA transcript expression, we profiled seven human cell lines with five different RNA-sequencing protocols, including short-read cDNA, Nanopore long-read direct RNA, amplification-free direct cDNA and PCR-amplified cDNA sequencing, and PacBio IsoSeq, with multiple spike-in controls, and additional transcriptome-wide N6-methyladenosine profiling data. We describe differences in read length, coverage, throughput and transcript expression, reporting that long-read RNA sequencing more robustly identifies major isoforms. We illustrate the value of the SG-NEx data to identify alternative isoforms, novel transcripts, fusion transcripts and N6-methyladenosine RNA modifications. Together, the SG-NEx data provide a comprehensive resource enabling the development and benchmarking of computational methods for profiling complex transcriptional events at isoform-level resolution.


Conflict of interest statement

Competing interests: J.G. received travel and accommodation expenses to speak at the Oxford Nanopore Community Meeting 2018. N.M.D. has previously received travel and accommodation expenses from Oxford Nanopore Technologies. H.G. has previously received travel and accommodation expenses from Oxford Nanopore Technologies. M.S. has been jointly funded by Oxford Nanopore Technologies and AI Singapore for the project AI-driven De Novo Diploid Assembler and has received travel funds to speak at events hosted by Oxford Nanopore Technologies. W.S.S.G. owns shares in Oxford Nanopore Technologies. The other authors declare no competing interests.

Figures

Fig. 1
Fig. 1. Overview of the SG-NEx datasets and processing pipeline.
a, Seven human cell lines were sequenced with multiple replicates using different RNA-seq protocols. Short-read cDNA was sequenced with 150-bp paired-end reads. hES cells, human embryonic stem cells. Icons from Noun Project under a Creative Commons license CC BY 3.0: colon, Mungang Kim; leukocytes, ProSymbols; liver, Prettycons; lung, Mahmure Alp; breast, Karina; ovary, Amethyst Studio; hES cells, DailyPM. b, Number of sequencing runs generated for each SG-NEx core cell line. c, Number of sequencing runs for each of the RNA-seq technologies. d, Illustration of the nf-core Nextflow pipeline (nanoseq) for streamlined processing of Nanopore long-read RNA-seq data.
Fig. 2
Fig. 2. Comparison of RNA-seq protocols.
a, Violin plot showing the median, upper and lower quartiles and 1.5 times the interquartile ranges of the sequencing throughput of RNA (direct RNA, n = 55), cDNA (direct cDNA, n = 30), PCR (cDNA, n = 27), PacBio IsoSeq (n = 6) and Illumina (n = 21) protocols. Circles represent MinION or GridION experimental runs without multiplexing, squares represent PromethION and non-demultiplexed experimental runs, and triangles represent demultiplexed experimental runs. b, Violin plot showing the median, upper and lower quartiles and 1.5 times the interquartile ranges of the average read length per sample of RNA (direct RNA, n = 55), cDNA (direct cDNA, n = 30), PCR (cDNA, n = 27), PacBio IsoSeq (n = 6) and Illumina (n = 21) protocols. Each point represents an experimental run, squares represent PromethION and non-demultiplexed experimental runs, and triangles represent demultiplexed experimental runs. c, Coverage along the normalized transcript length for RNA (direct RNA), cDNA (direct cDNA), PCR (cDNA), PacBio IsoSeq and Illumina protocols. Each light shaded line represents the average across one cell line, and the darker shaded line represents the average across all cell lines for each protocol. d, Box plots showing the median, upper and lower quartiles, and 1.5 times the interquartile ranges of the percentage of reads being uniquely or multi-mapped to transcripts, and whether the read is full-splice-junction matched to the transcript or not (full-splice-match versus partial) for all five protocols (n = 55, 30, 27, 6 and 21 for direct RNA, direct cDNA, cDNA, PacBio and Illumina, respectively). e, Transcription diversity depicted by the percentage of reads attributed to the number of genes ranked by expression levels from highest to lowest for the five protocols. The dashed line represents the top 1,000 expressed genes, and colored numbers indicate the percentage of reads accounted for them. f, Mean read coverage of genes generated using the direct RNA and the PCR cDNA protocol. Each point is colored by the density of genes. Sp.R, Spearman correlation.
Fig. 3
Fig. 3. Long-read RNA-seq shows consistency in gene expression quantification with short-read RNA-seq data.
a, Scatterplots of spike-in gene log2-transformed CPM values obtained from long-read direct cDNA and PCR cDNA RNA-seq (using Salmon), and short-read RNA-seq (using Salmon), compared with expected log2-transformed spike-in CPM for five different spike-in RNAs. Light blue points represent Sequin Mix A version 1 and SIRV E2; dark blue points represent Sequin Mix A version 2, ERCC and SIRV E0 + long SIRV RNAs. b, Box plots showing the median, upper and lower quartiles, and 1.5 times the interquartile ranges of the Spearman correlation between log2-transformed CPMs (using Salmon) for protein-coding genes from replicates generated by different protocols. Light green represents replicates from different cell lines (inter-cell line: n = 667, 617, 534, 514, 447 and 411 for dRNA versus cDNA, dRNA versus dcDNA, cDNA versus dcDNA, dRNA versus Illumina, cDNA versus Illumina, and dcDNA versus Illumina, respectively) and light blue represents replicates from the same cell line (intra-cell line: n = 113, 103, 90, 86, 73 and 69. c, Box plots showing the median, upper and lower quartiles, and 1.5 times the interquartile ranges of the Spearman correlation between log2-transformed CPMs (using Salmon) for long-noncoding RNA genes from replicates generated by different protocols. Light green represents replicates from different cell lines (inter-cell line: n = 667, 617, 534, 514, 447 and 411, for dRNA versus cDNA, dRNA versus dcDNA, cDNA versus dcDNA, dRNA versus Illumina, cDNA versus Illumina, and dcDNA versus Illumina, respectively). Light blue represents replicates from the same cell line (intra-cell line: n = 113, 103, 90, 86, 73 and 69). d, Scatterplot of log2-transformed CPMs from protein-coding genes obtained from long-read direct cDNA (using Salmon) compared with those obtained from short-read RNA-seq (using Salmon) in the A549 cell line. e, Scatterplot of log2-transformed CPMs from long-noncoding genes obtained from long-read direct cDNA (using Salmon) compared with those obtained from short-read RNA-seq (using Salmon) in the A549 cell line. f, Heatmap showing the correlation of gene log2-transformed CPM estimates across the SG-NEx samples generated using PCR cDNA, direct cDNA, direct RNA and short-read protocols.
Fig. 4
Fig. 4. Long-read RNA-seq data improves read-to-transcript assignment and transcript abundance estimation compared to short-read RNA-seq data.
a, Scatterplots of log2-transformed CPM values obtained from long-read direct cDNA and PCR cDNA, and short-read RNA-seq, compared with expected log2-transformed CPMs for spike-in transcripts of four different spike-in RNAs. Light blue points represent Sequin Mix A version 1 and SIRV E2; dark blue points represent Sequin Mix A version 2, and SIRV E0 + long SIRV RNAs. b, Box plots showing the median, upper and lower quartiles, and 1.5 times the interquartile ranges of the Spearman correlation coefficient for mean log2-transformed CPM estimates for dominant-status-categorized protein-coding gene isoforms between different RNA-seq protocols for each cell line (n = 7). Dark blue indicates comparison between long-read RNA-seq protocols; light blue indicates comparison between long-read and short-read protocols. c, Scatterplot of log2-transformed CPM for dominant-status-categorized protein-coding gene isoforms obtained from long-read direct cDNA RNA-seq compared with those obtained from short-read RNA-seq in the A549 cell line. d, Fraction of alternative events identified when comparing major isoforms only in long-read (long-read-specific major isoform) and major isoforms only in short-read RNA-seq (short-read-specific major isoform). Background simulation distribution with mean ± s.d. represented by a point with an error bar (n = 20). eg, Box plots showing the median, upper and lower quartiles, and 1.5 times the interquartile ranges of the fraction of dominant-status-categorized protein-coding gene isoforms expressed with at least 1 CPM (e), the number of junctions covered per read (f) and the number of transcripts uniquely assigned per read for all experiments categorized by five RNA-seq protocols (g; n = 55, 30, 27, 6 and 21, for direct RNA, direct cDNA, cDNA, PacBio and Illumina, respectively).
Fig. 5
Fig. 5. Long-read-specific major isoform is more robust compared to short-read-specific major isoform.
a, Schematic of fragmentation simulation of short-read (SR) from long-read (LR) data. bd, Box plots showing the median, upper and lower quartiles, and 1.5 times the interquartile range of the Spearman correlation (b) and mean absolute error (c) between LR and matched in silico-simulated short-read RNA-seq data (fragmented LR), and the Spearman correlation between SR and LR or fragmented LR (d), for Major isoforms, long-read-specific major isoforms, short-read-specific major isoforms and Minor isoforms. Light gray lines connect the metrics from the same sample pair (n = 67). e,f, From left to right, the scatterplots showing the log10-transformed: average concentration (cop/µl, copies per microlitre) versus CPM estimates in cDNA long-read RNA-seq data (left); average concentration (cop/µl) versus transcripts per million (TPM) estimates in Illumina short-read RNA-seq data (middle); average concentration (cop/µl) for the long-read-specific major isoform versus that of the short-read-specific major isoform (right); e, candidate genes where the short-read-specific major isoform and the long-read-specific major isoform can be uniquely identified; f, candidate genes where the short-read specific major isoform is a subset of the long-read-specific major isoform. g,k, Genomic annotations for the long-read-specific and short-read-specific major isoforms and the sequences amplified for each isoform in qPCR with reverse transcription (RT–qPCR) and dPCR experiments. For example, RPL37A (g), where short-read-specific major isoform is not a subset isoform, and RPL31 (k), where short-read-specific major isoform is a subset isoform. h,l, Line plots showing the relationship between the number of PCR cycles and the RFUs in the RT–qPCR experiments, for the assays designed for the long-read-specific and short-read-specific major isoforms of RPL37A (h) and RPL31 (l). The dotted gray line indicates the threshold defaulted at 50. i,j,m,n, Scatterplots showing RFUs in all analyzed partitions, for the assays designed for the long-read-specific (i) and short-read-specific (j) major isoforms of RPL37A, and the long-read-specific (m) and short-read-specific (n) major isoforms of RPL31. Dark blue indicates a positive reaction, and light gray indicates a negative reaction.
Fig. 6
Fig. 6. Profiling of complex transcriptional events, novel transcript, full-length fusion transcript and m6A modification in seven human cell lines.
a, Bar plots of different isoform switching-type events in the seven human cell lines. b, Upset plot of isoform switching event combinations. Top, number of isoforms for each combination. c, Heatmap showing the expression levels of 325 isoforms showing significant dominant isoform switching events across the seven human cell lines. The type of events associated with the isoform is indicated at the bottom. Expression is shown for the cell-type-specific isoforms. d, Heatmap of fusion gene candidates detected using long-read RNA-seq data, showing the status of validations in this study and in the literature (top), number and class of breakpoints (middle) and full-splice-match read support for the 5′ gene, 3′ gene and the fusion gene (bottom). e, Workflow for identifying m6A positions from direct RNA-seq data. f, Heatmap showing the clustering of direct RNA-seq samples based on the similarity of their m6A profile. The similarity was estimated using a two-sided Fisher’s test based on the number of common m6A sites among all sites that were tested for m6A in each pairwise comparison. The odds ratio was then used as enrichment score across sample replicates from the seven cell lines. g, Bar plots showing the number of m6A sites that were found across the SG-NEx cell lines, for predicted m6A sites at genes that are expressed across all cell lines (blue, top), and predicted m6A positions at genes that are expressed in at least one cell line (green, bottom). h, The MYC gene with m6ACE-seq-detected m6A positions (green bars) and m6Anet-detected m6A probability inferred from direct RNA-seq data (blue bars). The direct RNA-seq coverage is shown in light blue for each cell line.

References

    1. GTEx Consortium. The GTEx Consortium atlas of genetic regulatory effects across human tissues. Science369, 1318–1330 (2020). - PMC - PubMed
    1. Demircioğlu, D. et al. A pan-cancer transcriptome analysis reveals pervasive regulation through alternative promoters. Cell178, 1465–1477 (2019). - PubMed
    1. PCAWG Transcriptome Core Group. et al. Genomic basis for RNA alterations in cancer. Nature578, 129–136 (2020). - PMC - PubMed
    1. Wang, E. T. et al. Alternative isoform regulation in human tissue transcriptomes. Nature456, 470–476 (2008). - PMC - PubMed
    1. Kahles, A. et al. Comprehensive analysis of alternative splicing across tumors from 8,705 patients. Cancer Cell34, 211–224 (2018). - PMC - PubMed

LinkOut - more resources