. 2025 Apr;5(4):622-641.
doi: 10.1038/s43587-025-00816-2. Epub 2025 Mar 13.

Interleukin-12 signaling drives Alzheimer's disease pathology through disrupting neuronal and oligodendrocyte homeostasis

Affiliations

Interleukin-12 signaling drives Alzheimer's disease pathology through disrupting neuronal and oligodendrocyte homeostasis

Shirin Schneeberger et al. Nat Aging. 2025 Apr.

Abstract

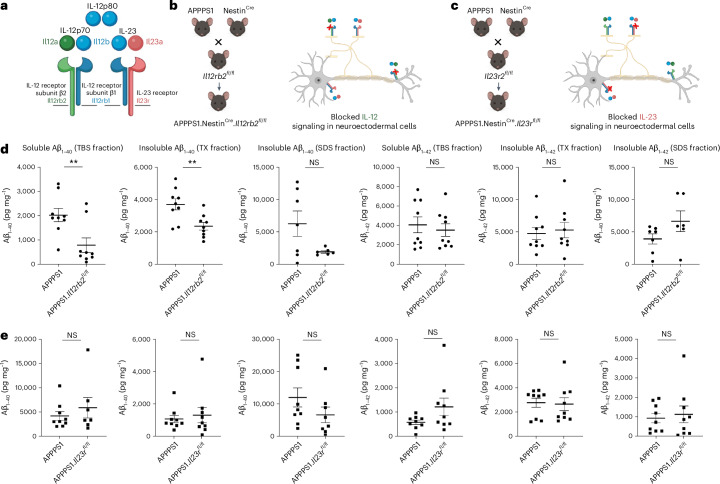
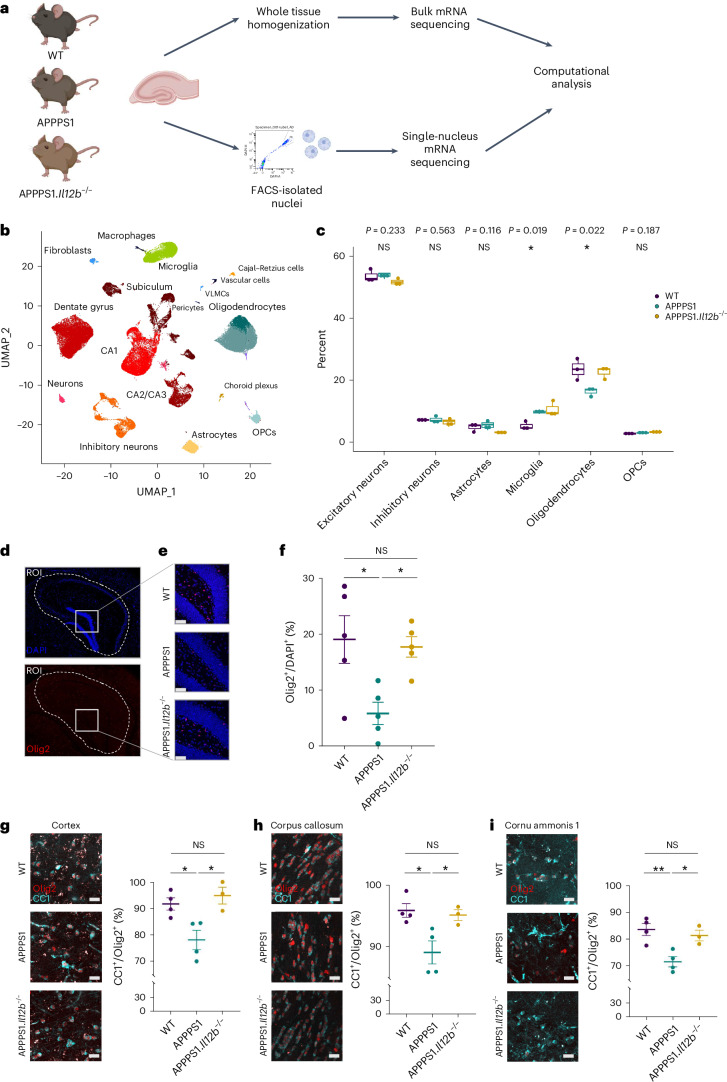
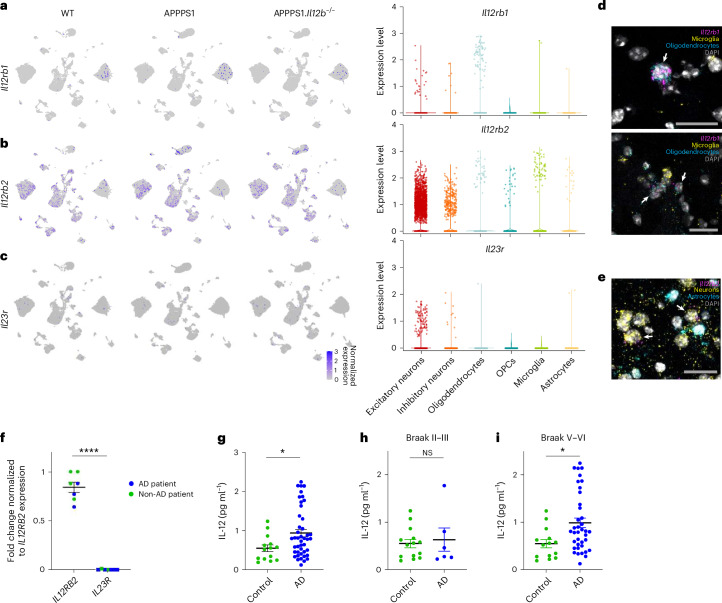
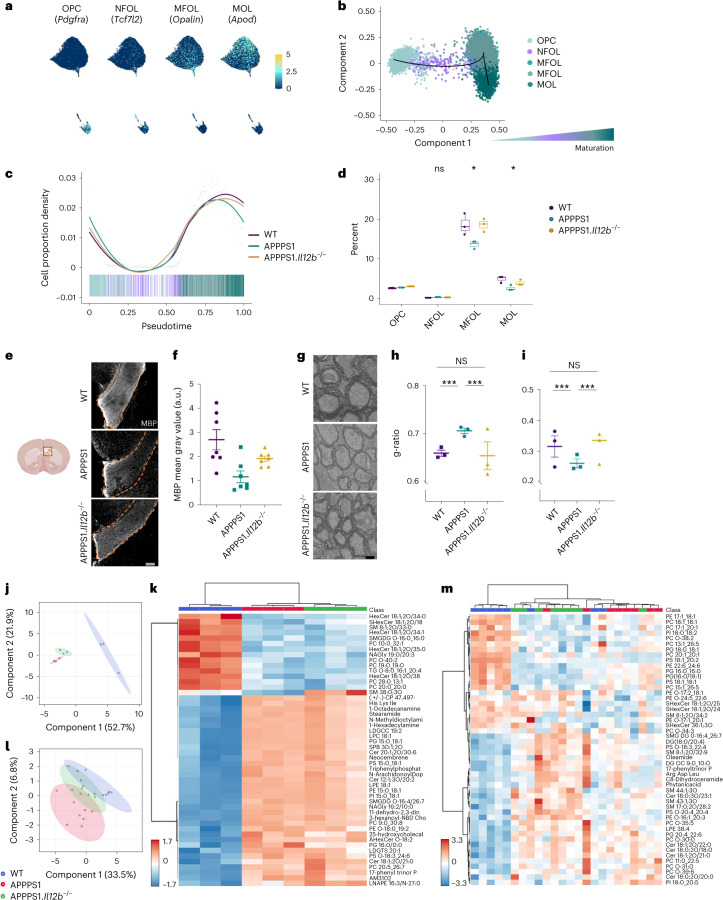
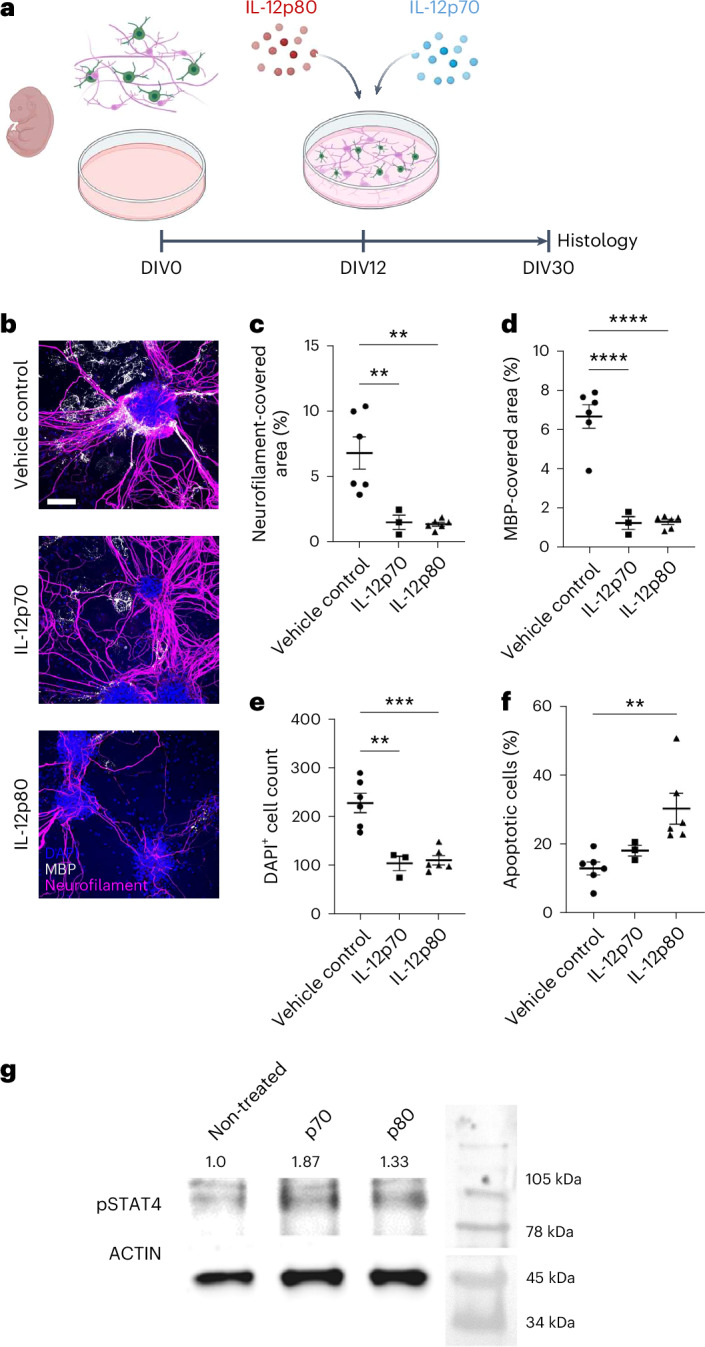
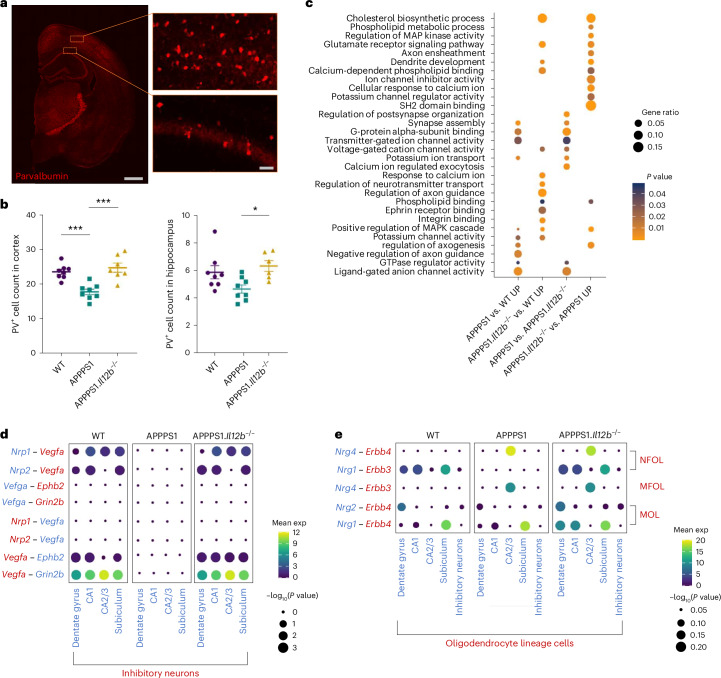
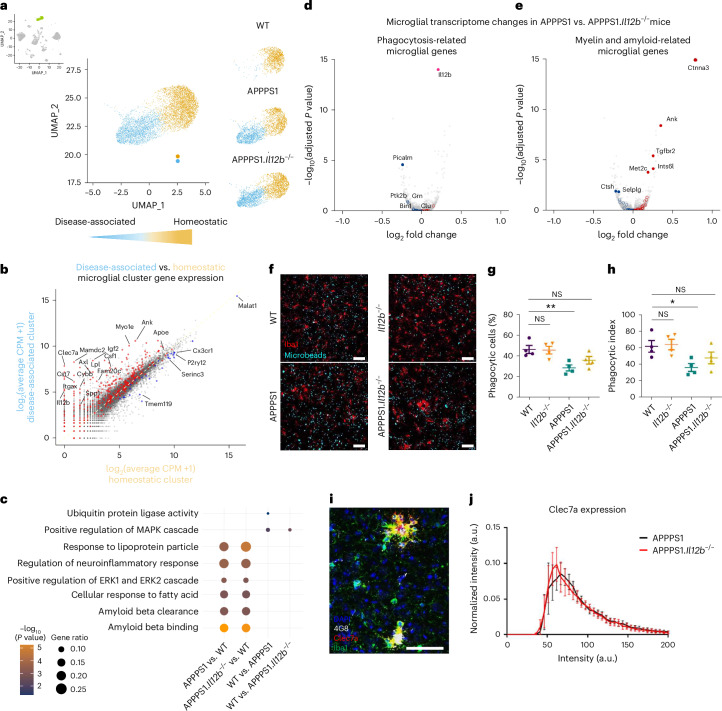
Neuroinflammation including interleukin (IL)-12/IL-23-signaling is central to Alzheimer's disease (AD) pathology. Inhibition of p40, a subunit of IL-12/IL-23, attenuates pathology in AD-like mice; however, its signaling mechanism and expression pattern remained elusive. Here we show that IL-12 receptors are predominantly expressed in neurons and oligodendrocytes in AD-like APPPS1 mice and in patients with AD, whereas IL-23 receptor transcripts are barely detectable. Consistently, deletion of the IL-12 receptor in neuroectodermal cells ameliorated AD pathology in APPPS1 mice, whereas removal of IL-23 receptors had no effect. Genetic ablation of IL-12 signaling alone reverted the loss of mature oligodendrocytes, restored myelin homeostasis, rescued the amyloid-β-dependent reduction of parvalbumin-positive interneurons and restored phagocytosis-related changes in microglia of APPPS1 mice. Furthermore, IL-12 protein expression was increased in human AD brains compared to healthy age-matched controls, and human oligodendrocyte-like cells responded profoundly to IL-12 stimulation. We conclude that oligodendroglial and neuronal IL-12 signaling, but not IL-23 signaling, are key in orchestrating AD-related neuroimmune crosstalk and that IL-12 represents an attractive therapeutic target in AD.


Conflict of interest statement

Competing interests: All authors declare that they have no competing interests.

Figures

Fig. 1
Fig. 1. Deletion of IL-12-specific receptor subunit IL12Rβ2 results in reduction of amyloid burden.
a, p40 can form monodimers (IL-12p80) or heterodimers (IL-12p70) consisting of p35 and p40. IL-12p70 binds to the dimerized IL-12Rβ2 and IL-12Rβ1. IL-23, consisting of p19 and p40, binds to the receptor subunits IL-23R and IL-12Rβ1. The genes that encode the respective protein subunits are shown in matched color. This illustration was created in BioRender: Geesdorf, M. (2025) https://BioRender.com/w20e262. b,c, By crossbreeding either Il12rb2fl/fl or Il23rfl/fl mice to APPPS1 and to NestinCre animals, IL-12-specific or IL-23-specific receptor deletion was achieved in neuroectodermal cells of AD-like mice. This illustration was created in BioRender: Geesdorf, M. (2025) https://BioRender.com/m33j769 and https://BioRender.com/q27e982. d, Proteins from total brains of 250-day-old APPPS1.NestinCre.Il12rb2fl/fl mice (n = 9) and APPPS1 littermates expressing functional Il12rb2 (n = 9) were extracted based on their solubility and assessed for Aβ1–40 and Aβ1–42 in the soluble (TBS) and insoluble (Triton-X and SDS) fractions using an electrochemiluminescence ELISA assay (Meso Scale). Aβ1–40: t = 3.062, df = 16, **P = 0.0075 for the TBS fraction; t = 3.256, df = 16, **P = 0.0050 for the TX fraction; and t = 2.034, df = 11, P = 0.668 for the SDS fraction; Aβ1–42: unpaired t-tests, t = 0.5092, df = 16, P = 0.6175 for the TBS fraction; t = 0.3554, df = 16, P = 0.7269 for the TX fraction; and t = 1.627, df = 11, P = 0.1319 for the SDS fraction. e, Aβ1–40 and Aβ1–42 levels in APPPS1.NestinCre.Il23rfl/fl mice (n = 9) and APPPS1 littermates with functional IL-23 receptor subunit (n = 9) upon similar workup as described in d; Aβ1–40: t = 0.7989, df = 14, P = 0.4377 for the TBS fraction; t = 0.4474, df = 16, P = 0.6606 for the TX fraction; and t = 1.393, df = 15, P = 0.1838 for the SDS fraction; Aβ1–42: t = 1.710, df = 16, P = 0.1066 for the TBS fraction; t = 0.1808, df = 16, P = 0.8588 for the TX fraction; and t = 0.3960, df = 16, P = 0.69731 for the SDS fraction. Data were analyzed as two-tailed unpaired t-test; bars represent mean ± s.e.m. df, degrees of freedom; NS, not significant.
Fig. 2
Fig. 2. IL-12/Il-23 signaling reduces hippocampal oligodendrocytes in a mouse model of AD.
a, Experimental outline. Isolated nuclei from hippocampi of 250-day-old animals (n = 3 per genotype), purified by FACS and used for snRNA-seq. Bulk RNA-seq libraries were prepared from RNA isolated of hippocampi (n = 3 per genotype). If not stated otherwise, figures reflect results from snRNA-seq. Illustration was created in BioRender: Geesdorf, M. (2025) https://BioRender.com/a60r345. b, UMAP plot showing 37 hippocampal cell clusters representing combined snRNA-seq data from three biological replicates per genotype. Cell types were assigned based on known markers. c, Cell type proportions in hippocampal samples across all three genotypes. Each dot represents one biological replicate (n = 3). One-way ANOVA with Holm–Bonferroni P value adjustment, df = 2. F = 1.945 for excitatory neurons, F = 0.563 for inhibitory neurons, F = 0.116 for astrocytes, F = 8.279 for microglia, F = 7.720 for oligodendrocytes and F = 2.245 for OPCs; boxplots show middle, median; lower hinge, 25% quantile; upper hinge, 75% quantile; upper/lower whisker, largest/smallest observation less/greater than or equal to upper/lower hinge ± 1.5× IQR. d, Mouse brain sections stained with DAPI (blue) and for Olig2 (red). The hippocampal outline was defined as the ROI (dashed white line) for quantifying Olig2+ cells. Scale bar, 100 µm. e, Representative zoomed-in images of brain tissue from WT, APPPS1 and APPPS1.Il12b−/− mice showing Olig2+ cells. f, Quantification of Olig2+ cells normalized to DAPI+ cells in hippocampal regions (n = 5 per genotype with 3–6 sections per animal). One-way ANOVA with Tukey’s multiple comparison test, df = 2, F = 6.270, *P = 0.0137. Each symbol represents one mouse. Bars represent mean ± s.e.m. gi, Quantification of CC1+/Olig2+ mature oligodendrocytes in cortex, corpus callosum and CA1. n = 4 for WT and APPPS1 and n = 3 for APPPS1.Il12b−/− mice. Scale bar, 100 µm. gi, One-way ANOVA with Tukey’s multiple comparison test on WT (mean = 91.67 ± s.e.m.), APPPS1 (mean = 77.99 ± s.e.m.) and APPPS1.Il12b−/− (mean = 94.87 ± s.e.m.), df = 2, F = 0.8176, *P = 0.0116 (g); WT (mean = 95.85 ± s.e.m.), APPPS1 (mean = 89.05 ± s.e.m.) and APPPS1.Il12b−/− (mean = 95.09 ± s.e.m.), df = 2, F = 7.132, *P = 0.0167 (h); WT (mean = 83.52 ± s.e.m.), APPPS1 (mean = 71.51 ± s.e.m.) and APPPS1.Il12b−/− (mean = 81.31 ± s.e.m.), df = 2, F = 10.04, **P = 0.0066. (i). df, degrees of freedom; IQR, interquartile range; NS, not significant.
Fig. 3
Fig. 3. IL-12 and IL-23 receptor transcript expression and IL-12 protein levels in mouse and/or human postmortem brain tissue.
a, Il12rb1, coding for IL-12 receptor subunit β1, is equally expressed across all three mouse genotypes (as indicated) and occurs most pronouncedly in oligodendrocytes. Violin plot showing captured Il12rb1 transcripts across cell types. b, Il12rb2, coding for IL-12 receptor subunit β2, is strongly expressed in neurons and, to a lesser extent, in microglia, oligodendrocytes, OPCs and astrocytes. Violin plot showing captured Il12rb2 transcripts across cell types. c, Il23r transcripts were only barely expressed in the aged mouse hippocampus. Violin plot showing captured Il23r transcripts across cell types. d, smFISH on brain tissue of APPPS1 mice revealed Il12rb1 mRNA+ puncta (pink) in oligodendrocytes (marked by expression of Sox10 mRNAs (blue)); microglia expressing Tmem119 and Sall1 are marked by yellow puncta; DAPI shown in gray depicts cell nuclei. e, Il12rb2 mRNA+ puncta (pink) in neurons (marked by Map2 and NeuN mRNAs (yellow)); astrocytes expressing Aldh1l1, Gfap and Glast are marked in blue; DAPI shown in gray depicts cell nuclei. Signals specific to Il23r mRNA were not detectable. Scale bar, 25 μm. f, Human postmortem hippocampal brain tissue from individuals without dementia (n = 4) and from patients with AD (n = 3). qPCR results showing IL12RB2 and IL23R gene expression in bulk human hippocampal tissue, ****P = 1.678 × 10−9, t = 16.14, df = 12. Statistical analysis using two-tailed unpaired Student’s t-test. gi, IL-12p70 protein as measured by ELISA in soluble tissue fraction of frontal cortex from age-matched non-AD controls (n = 14) and from patients with AD (n = 44). Statistical analysis using two-sided Mann–Whitney test for age-matched healthy controls (median = 0.5395 ± s.e.m.) and for patients with AD (median = 0.7946 ± s.e.m.), *P = 0.0316; Braak II–III: P = 0.8411, Braak V–VI: *P = 0.0117. df, degrees of freedom; NS, not significant.
Fig. 4
Fig. 4. Reduced number of mature oligodendrocytes in the amyloid-carrying hippocampus of AD-like mice exhibit compromised myelin ensheathment.
a, Feature plots highlighting markers that characterize known oligodendrocyte maturation states. b, Pseudotemporal ordering of oligodendrocytes revealed differentiation along the known maturation trajectory from OPC via NFOL to MFOL and MOL. c, Cell proportion density along the pseudotime suggests a decrease of more mature oligodendrocytes in the amyloid-carrying APPPS1 mouse hippocampus. d, Reduction of oligodendrocytes reaches statistical significance at the stage of MFOL and MOL and is rescued by the absence of IL-12. n = 3 per genotype, df = 2, F = 2.067 for OPC, F = 1.443 for NFOL, F = 6.184 for MFOL and F = 6.705 for MOL; statistical analysis done by one-way ANOVA with Holm–Bonferroni P value adjustment; boxplots show middle, median; lower hinge, 25% quantile; upper hinge, 75% quantile; upper/lower whisker, largest/smallest observation less/greater than or equal to upper/lower hinge ± 1.5× IQR. e, Representative immunohistochemical MBP staining of corpus callosum from 250-day-old WT, APPPS1 and APPPS1.Il12b−/− mouse brains. f, Analysis of MBP mean gray value, normalized by DAPI mean gray value. One-way ANOVA with Tukey’s multiple comparison test, df = 2, F = 7.185, **P = 0.0051. Each symbol represents one mouse. Bars represent mean ± s.e.m. g, Representative ultrastructural images depicting the hippocampal alveus of 250-day-old WT, APPPS1 and APPPS1.Il12b−/− mice. Scale bar, 2 µm. h, Analysis of g-ratio depicting the proportion of the inner axonal diameter to the total outer myelin, Kruskal–Wallis chi-squared = 126.83, df = 2, P < 2.2 × 10−16. i, Myelin sheath thickness of n = 3 mice per genotype, Kruskal–Wallis chi-squared = 23.244, df = 2, P = 8.966 × 10−6. Electron microscopy images were analyzed by Kruskal–Wallis rank-sum test with Bonferroni correction for multiple testing. Bars represent mean ± s.e.m. j, PLS-DA plot of lipidomics data of 120-day-old WT, APPPS1 and APPPS1.Il12b−/− white matter. k, Heatmap of lipidomics data of 120-day-old WT, APPPS1 and APPPS1.Il12b−/− white matter. l, PLS-DA plot of lipidomics data of 250-day-old WT, APPPS1 and APPPS1.Il12b−/− white matter. m, Heatmap of lipidomics data of 250-day-old WT, APPPS1 and APPPS1.Il12b−/− white matter. df, degrees of freedom; IQR, interquartile range; NS, not significant.
Fig. 5
Fig. 5. IL-12p70 or IL-12p80 stimulation of murine embryonic primary myelinating culture results in reduced neurofilament and myelination.
a, Cell culture from E13 murine spinal cords treated with either IL-12p70 or IL-12p80 from DIV12 to DIV30. b, Immunocytochemistry from DIV30: blue, DAPI; white, MBP; pink, neurofilament. Scale bar, 100 µm. c, Quantification of neurofilament-covered area (%), biological replicates of vehicle-treated and IL-12p80-treated (n = 6) and IL-12p70-treated (n = 3) cell cultures, one-way ANOVA for vehicle control (mean = 6.780 ± s.e.m.), IL-12p70 (mean = 1.513 ± s.e.m.) and IL-12p80 (mean = 1.368 ± s.e.m.), df = 2, F = 13.09, P = 0.0010. d, Quantification of MBP-covered area (%), biological replicates of vehicle-treated and IL-12p80-treated (n = 6) and IL-12p70-treated (n = 3) cell cultures, one-way ANOVA for vehicle control (mean = 6.682 ± s.e.m.), IL-12p70 (mean = 1.237 ± s.e.m.) and IL-12p80 (mean = 1.295 ± s.e.m.), df = 2, F = 52.70, P < 0.0001. e, DAPI+ cell count, biological replicates of vehicle-treated and IL-12p80-treated (n = 6) and IL-12p70-treated (n = 3) cell cultures, one-way ANOVA for vehicle control (mean = 227.0 ± s.e.m.), IL-12p70 (mean = 104.0 ± s.e.m.) and IL-12p80 (mean = 110.2 ± s.e.m.), df = 2, F = 19.80, P = 0.0002. f, Quantification of apoptotic cells (%), biological replicates of vehicle-treated and IL-12p80-treated (n = 6) and IL-12p70-treated (n = 3) cell cultures, Kruskal–Wallis test for vehicle control (mean = 3.832 ± s.e.m.), IL-12p70 (mean = 7.333 ± s.e.m.) and IL-12p80 (mean = 12.50 ± s.e.m.), Kruskal–Wallis statistic = 11.35, P < 0.0001. g, Actin and pSTAT4 western blot analysis of IL-12p70-treated, IL-12p80-treated and non-treated primary oligodendrocytes; non-treated: 1.0 (left), IL-12p70-stimulated: 1.87 (center) and IL-12p80: 1.33 (right); pSTAT4 signal normalized to actin signal. df, degrees of freedom. Source data
Fig. 6
Fig. 6. IL-12 signaling leads to transcriptional changes in mouse hippocampal and cortical neurons.
a, Representative images of PV+ interneurons in the cortex and hippocampus of APPPS1.Il12b−/− mice. b, Quantification of PV+ interneurons comparing WT (cortex mean = 23.49 ± s.e.m.; CA1 mean = 5.868 ± s.e.m.), APPPS1 (cortex mean = 17.67 ± s.e.m.; CA1 mean = 4.653 ± s.e.m.) and APPPS1.Il12b−/− mice (cortex mean = 24.66 ± s.e.m.; CA1 mean = 6.324 ± s.e.m.) (n = 8 per genotype), one-way ANOVA, df = 2, F = 4.620, P = 0.232 for CA1 and one-way ANOVA, df = 2, F = 15.68, P < 0.0001 for cortex. c, GO analysis of genes upregulated in subiculum comparing APPPS1 versus WT mice, APPPS1.Il12b−/− versus WT mice, APPPS1 versus APPPS1.Il12b−/− mice and APPPS1.Il12b−/− versus APPPS1 mice. d,e, Using CellPhoneDB, dot plot showing the predicted receptor–ligand interactions between neuronal cell types (d) and oligodendrocytes (e) in WT, APPPS1 and APPPS1.Il12b−/− mice. P values are indicated by the circle size, and means of the average expression level are color coded. df, degrees of freedom; exp, expression.
Fig. 7
Fig. 7. Microglia in APPPS1 and APPPS1.Il12b−/− mice share gene signatures associated with enhanced microgliosis but exhibit distinct phagocytotic phenotypes.
a, Distinct homeostatic (yellow) and disease-associated (blue) microglia clusters were found in the combined snRNA-seq dataset with the disease-associated clusters present only in APPPS1 and APPPS1.Il12b−/− mice. b, Scatterplot comparing the gene expression in the disease-associated clusters versus the homeostatic clusters. c, GO analysis of differentially upregulated genes per indicated genotypes. The dot size illustrates gene ratio, and the color denotes P value. Violin plot showing log2FC of certain specific genes to the corresponding GO term. Fisher’s exact test and the GO algorithm ‘elim’. d,e, Volcano plots showing differentially expressed genes in microglia of APPPS1 mice compared to APPPS1.Il12b−/− mice (downregulated: blue; upregulated: red) known to be involved in phagocytosis of microglia (d) or to be myelin related or amyloid related (e). Adjusted P value by Benjamini–Hochberg. A cluster of selected AD risk genes involved in phagocytosis in ex vivo human microglia and human brain lysates, served as reference for assessing phagocytosis-related microglial transcriptome changes, which, upon conversion into their mouse orthologs, resulted in 27 genes comprising Bin1, Ptk2b, Trem2, Zyx, Apbb3, Clu, Rin3, Cd33, Ms4a4a, Cr1l, Grn, Apoe, Picalm, Cd2ap, Plcg2, Sorl1, Fermt2, Ap4e1, Zkscan1, Abca7, Siglech, Trp53inp1, Abi3, Rabep1, Cass4, Ap4m1 and Sppl2a. Myelin-related or amyloid-related transcriptome changes in microglia (right) were defined by referencing the gene list described by Depp et al. (Supplementary Table 1, tab 6) depicting differentially expressed genes of DAM derived from 6-month-old mice with amyloid pathology and/or mutant myelin, followed filtering by logFC > 0.25 and FDR < 0.01. Genes that were altered significantly are shown as filled circles (FDR < 0.05); open circles indicate differences that did not reach statistical significance. Il12b served as internal control. fh, Phagocytic activity of microglia in adult acute brain slices of WT and APPPS1 mice with and without IL-12 signaling. Organotypic brain slices prepared from 90-day-old WT (Il12b+/+), Il12b−/−, APPPS1 and APPPS1.Il12b−/− mice were incubated with fluorescent microbeads to analyze phagocytic microglia. Representative views from 15-μm confocal z-stacks showing uptake of fluorescent microbeads (in green) by microglia (labeled with Iba1, red) in brain slices of mice with the indicated genotypes (f). Percentage of phagocytic microglia with engulfed microbeads (P = 0.0104) (g) and phagocytic index (P = 0.0314) (h). For the calculation of the phagocytic index, phagocytic cells were grouped according to the number of ingested microbeads, with 1–3 microbeads = grade 1; 4–6 microbeads = grade 2; 7–10 microbeads = grade 3; and more than 10 microbeads = grade 4. Each grade (1–4) was multiplied with the respective percentage of phagocytic microglia to calculate the phagocytic index. Scale bar, 50 μm. n = 4 mice per group (mean ± s.e.m., one-way ANOVA with Dunnett’s post hoc test with WT as control group). i, Representative immunohistochemical image of Clec7a, Iba1 and 4G8 staining in APPPS1.Il12b−/− mouse brain cortical tissue. Scale bar, 100 µm. j, Clec7a staining intensity within plaque‐associated Iba1+ microglia in WT and APPPS1.Il12b−/− mice (n = 6). Mean ± s.e.m., statistical analysis: two‐tailed unpaired t‐test with Bonferroni correction for each single bin, P = NS. NS, not significant.
Extended Data Fig. 1
Extended Data Fig. 1. Human IL-12/IL-23 receptor expression and mouse snRNA-seq data quality and cluster annotation.
Single-nucleus transcriptome data of 76,533 total nuclei isolated from two postmortem human primary motor cortex derived from portal.brainmap.org 4. a-c. Violin plots showing captured IL12RB1, IL12RB2 and IL23R transcripts per cell type in the human cortex. d,e. Violin plots depicting various murine hippocampal cell types: gene count per cell (d) and UMI count per cell (e), averaging at 1,412 genes and 2,421 UMI, respectively. f-h. Doublet discrimination identified roughly 5% of all nuclei as doublets. From a total of 44 detected clusters, cluster 25, 31, 33, 34, 41, 42, 42 and 44 were flagged as clusters carrying doublets using Scrublet (v.0.21). Clusters with >50% of doublets were removed from further analysis. i. Bar graph depicting biotypes of detected RNA shows that approximately 85.7% of all transcripts were protein-coding followed by 13.4% long non-coding RNAs (lncRNAs). j. Heatmap showing cell type-specific lncRNAs. k. Cellular proportions of our snRNA-seq mouse study reflected the l. published cellular composition of the hippocampus according to the Blue Brain Cell Atlas.
Extended Data Fig. 2
Extended Data Fig. 2. Absence of major batch effects in hippocampal snRNA-seq data from 250-day old mice.
a. UMAP visualization of three individual biological replicates per genotype, showing mostly equal representations in each cluster. b-d. Entropy-based quantification of batch effects. The distribution of relative entropy values for cells of three individual biological replicates per genotype grouped by sample (original identity) or genotype was greater than randomizing these labels across cells (b). c-d. Different cell types grouped by genotype (c) and sample (d) (original identity); boxplots show: middle, median; lower hinge, 25% quantile; upper hinge, 75% quantile; upper/lower whisker, largest/smallest observation less/greater than or equal to upper/lower hinge ± 1.5 x IQR. Relative entropy per cell type was highest for cell types that differed biologically between genotypes, for example microglia and oligodendrocytes which react most strongly to amyloid and inflammatory conditions. Thus, differences were driven by biological meaningful distinctions rather than technical errors.
Extended Data Fig. 3
Extended Data Fig. 3. Various snRNA-seq and bulk RNA-seq analyses in 250-day-old mice reveal no significant changes in cell types other than oligodendrocytes and neurons.
a. Correlation of hippocampal snRNA-seq and bulk RNA-seq data with respect to the ratio in appearance of distinct cell types (r ≥ 0.75). b. Principal component analysis of biological replicates (bulk RNA-seq), each replicate is represented by one dot. WT mice cluster together, while APPPS1 and APPPS1.Il12b−/− mice are more scattered. c-d. MA plots comparing bulk gene expression of APPPS1 vs. WT mice (c) and of APPPS1.Il12b−/− vs. APPPS1 mice (d). e. Close-up of the astrocyte gene signatures derived from single-nucleus RNA-seq of WT, APPPS1 and APPPS1.Il12b−/− mice. f. Density plots illustrating the distribution of overall captured transcripts in WT vs. APPPS1 and APPPS1 vs. APPPS1.Il12b−/− mice. g. Feature plot of the distribution of Gfap transcripts in the astrocyte cluster and h. Gfap expression levels in WT, APPPS1 and APPPS1.Il12b−/−. i. Comparison of cellular proportions of three biological replicates per genotype determined by three independent methods, namely the previously published reference data set (red), snRNA-seq (green) and deconvolution of bulk RNA-seq data (dark blue). Of note, the deconvolution matched the other two reference data sets best in OPCs, microglia and oligodendrocytes. Boxplots show: middle, median; lower hinge, 25% quantile; 45 upper hinge, 75% quantile; upper/lower whisker, largest/smallest observation less/greater than or equal to upper/lower hinge ± 1.5 x IQR. j. Cellular proportions gathered from deconvoluted bulk RNA-seq data across all three genotypes with three biological replicates each showed enhanced numbers of microglia in APPPS1 and APPPS1.Il12b−/− mice and a rescue of oligodendrocytes numbers in APPPS1.Il12b−/− mice. All df = 2, F = 6.053 for neurons, F = 3.783 for astrocytes, F = 83.238 for microglia, F = 26.317 for oligodendrocytes, F = 6.216 for OPCs, F = 7.182 for vascular cells, F = 0.499 for rest. One-way ANOVA with Holm-Bonferroni P value adjustment; boxplots show: middle, median; lower hinge, 25% quantile; upper hinge, 75% quantile; upper/lower whisker, largest/smallest observation less/greater than or equal to upper/lower hinge ± 1.5 x IQR.
Extended Data Fig. 4
Extended Data Fig. 4. Differential gene expression of oligodendrocyte developmental states show unchanged OPC to oligodendrocyte maturation in amyloid-carrying APPPS1 mice.
a,b,c. Volcano plots showing differentially regulated genes across all genotypes in MOL (a), MFOL (b) and OPC (c). Pseudotime analysis for genes involved in positive regulation (GO:0048714) of oligodendrocyte maturation (d-e) and negative regulation (GO:0048715) of oligodendrocyte maturation (f-g) show no strong difference across genotypes.
Extended Data Fig. 5
Extended Data Fig. 5. IL-12-dependent status of murine oligodendrocytes and of matured human-oligodendrocyte-like cells.
a. Gene Ontology (GO) of differentially expressed transcripts of different types of oligodendrocytes derived from APPPS1 vs. APPPS1.Il12b−/− mice. Dot size illustrates gene ratio, color denotes P value. One-way ANOVA with Holm Bonferroni P value adjustment. b. Violin plot depicting log2-fold changes in expression of distinct genes of the analysis shown in (a). Red dots indicate genes with positive log2-fold changes, blue dots those with negative log2-fold changes. c. MBP-immunoreactivity in the cortex of APPPS1 and APPPS1.Il12b−/− versus WT control. Scale bar: 100µm. d. Quantification of MBP-covered area, n = 6 biological replicates per genotype, one-way ANOVA showed no significant differences. e. Cartoon illustrating human oligodendroglioma (HOG) cell maturation. f. qPCR of differentiated HOG cell line exemplifying oligodendrocyte-like cells versus non-differentiated HOG cells show a maturation-dependent increase in MBP expression, n = 3 technical replicates, Student’s t-test, P = 0.0178. g. Statistical analysis using two-tailed unpaired students t-test, t = 3.885, df = 4, n = 3 technical replicates. h. Maturation/differentiation-dependent increase in the expression of various pro-inflammatory cytokines in the supernatant of HOG upon stimulation with 85 nM IL-12p70, 85 nM IL-12p80 or vehicle only. Undifferentiated HOG cells are shown in green squares, differentiated HOG cells are in blue squares. All df = 17. F = 19.70 for IL-7, F = 85.55 for TNF-ß, F = 876.8 for VEGFA, F = 155.2 for IL-17, F = 117.4 for IL-1a, F = 232.2 for IL-16, n = 3 technical replicates. i Even doses as low as 1.5 nM IL-12p70 or 1.5 nM IL-12p80 suffice to induce cytokine expression in differentiated HOG cells, while 1.5 nM IL-23 has almost no effect. All df = 11, F = 73.8 for IL-15, F = 12.7 for TNF-ß, F = 67.3 for IL-1a, F = 79.2 for IL-16, F = 10.5 for VEGFA. Analyzed by one-way ANOVA with Tukey’s multiple-comparisons test. Each dot represents one technical replicate (n = 3). Bars represent mean ± s.e.m.
Extended Data Fig. 6
Extended Data Fig. 6. IL-12 signaling leads to transcriptional changes in neurons.
a, Subicular neurons appeared to be somewhat reduced in APPPS1 and APPPS1.Il12b−/− mice when compared to WT mice. All df = 2, F = 0.161 for dentate gyrus, F = 2.384 for CA1, F = 0.574 for CA2/CA3, F = 0.935 for subiculum, F = 0.633 for inhibitory neurons, n = 3 biological replicates per genotype. Statistical analysis done by one-way ANOVA with Holm-Bonferroni P value adjustment; boxplots show: middle, median; lower hinge, 25% quantile; upper hinge, 75% quantile; upper/lower whisker, largest/smallest observation less/greater than or equal to upper/lower hinge ± 1.5 x IQR. b, Volcano plots showing differentially regulated genes across genotypes in subiculum, dentate gyrus, CA1, CA2/3 and inhibitory neurons. ANOVA with Holm-Bonferroni P value adjustment. Red and blue dots are determined as statistically significant with p ≤ 0.01 and log2 fold-change ± > 0.5.
Extended Data Fig. 7
Extended Data Fig. 7. Comparing publicly available inflammatory protein and non-protein coding gene signatures of 5xFAD mice to those of APPPS1 mice.
a-b. Comparing published gene signatures of disease-associated microglia (DAM) and homeostatic microglia (green, b) from 5xFAD AD-like mice to respective microglia signatures from APPPS1 AD-like mice generated within this study reveals (blue, b) a substantial overlap. c-e Volcano plots comparing gene expression from all microglial cells in APPPS1 versus WT mice (c), APPPS1.Il12b−/− vs. WT mice (d) and APPPS1 vs APPPS1.Il12b−/− mice (e). f-g, UMAP feature plots showing non-coding transcripts for Neat1 (f) and Pvt1 (g). h-j, Volcano plot comparing APPPS1 vs. WT mice (h), APPPS1 vs. APPPS1.Il12b−/− mice (i) and APPPS1.Il12b−/− vs. WT mice (j) illustrating that the non-coding lncRNA Neat1 and Pvt1 were upregulated in both AD-related genotypes.

References

    1. Guerreiro, R. J. et al. Peripheral inflammatory cytokines as biomarkers in Alzheimer’s disease and mild cognitive impairment. Neurodegener. Dis.4, 406–412 (2007). - PubMed
    1. Heinzel, F. P., Hujer, A. M., Ahmed, F. N. & Rerko, R. M. In vivo production and function of IL-12 p40 homodimers. J. Immunol.158, 4381–4388 (1997). - PubMed
    1. Tait Wojno, E. D., Hunter, C. A. & Stumhofer, J. S. The immunobiology of the interlekun-12 family: room for discovery. Immunity50, 851–870 (2019). - PMC - PubMed
    1. Gately, M. K. et al. The interleukin-12/interleukin-12-receptor system: role in normal and pathologic immune responses. Annu. Rev. Immunol.16, 495–521 (1998). - PubMed
    1. Presky, D. H. et al. A functional interleukin 12 receptor complex is composed of two β-type cytokine receptor subunits. Proc. Natl Acad. Sci. USA24, 14002–14007 (1996). - PMC - PubMed

MeSH terms

LinkOut - more resources