Randomized Controlled Trial
. 2025 Apr;7(4):704-713.
doi: 10.1038/s42255-025-01247-4. Epub 2025 Mar 13.

Short-term effects of high-protein, lower-carbohydrate ultra-processed foods on human energy balance

Affiliations
Randomized Controlled Trial

Short-term effects of high-protein, lower-carbohydrate ultra-processed foods on human energy balance

Franziska A Hägele et al. Nat Metab. 2025 Apr.

Abstract

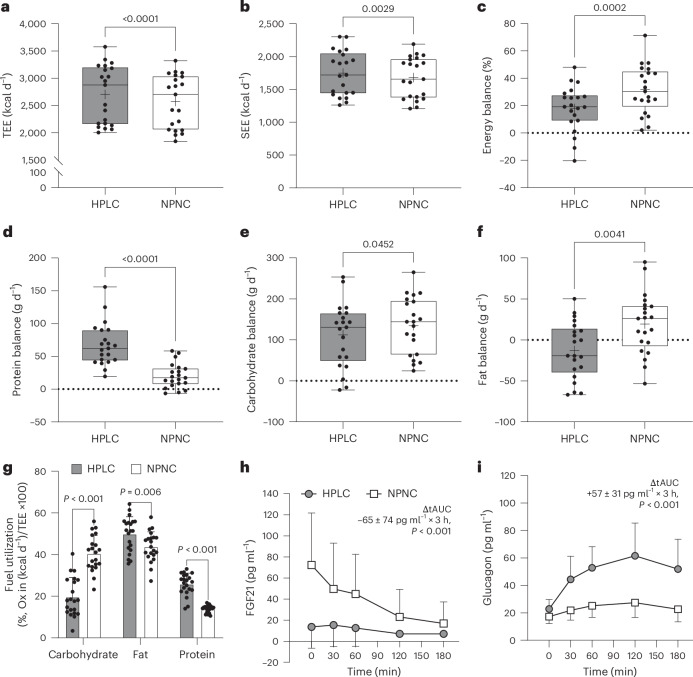
Protein-enriched ultra-processed foods (UPFs) are generally perceived as a healthy and favourable dietary choice for weight management. However, compared with low-processed foods, the consumption of UPFs has been demonstrated to result in overfeeding and gains in body weight and fat mass. Here we investigate the short-term effects of protein-enriched UPFs on energy intake and energy balance in a single-blind crossover trial involving 21 healthy young adults, who were randomly assigned to 2 UPF diets for 54 hours in a whole-room calorimeter. Participants received either a high-protein (30%) and lower-carbohydrate (29%) diet (HPLC-UPF) or a normal-protein (13%) and normal-carbohydrate (46%) diet (NPNC-UPF). Meals were equally palatable, matched for calories, fat and fibre, and consumed ad libitum. As primary outcomes, compared with NPNC-UPF consumption, the HPLC-UPF diet resulted in a higher energy expenditure (128 ± 98 kcal d-1) and lower energy intake (-196 ± 396 kcal d-1), leading to a less-positive energy balance (18% versus 32%) with gains in protein and carbohydrate balance only. Postprandial ghrelin levels were lower, whereas glucagon and peptide YY levels were higher with HPLC-UPF compared with NPNC-UPF (secondary outcomes). Despite a reduction in energy intake and increased energy expenditure, the short-term consumption of protein-enriched UPFs did not prevent overeating but did favourably affect energy partitioning. ClinicalTrials.gov registration: NCT05337007 .


Conflict of interest statement

Competing interests: The authors declare no competing interests.

Figures

Fig. 1
Fig. 1. Ad libitum food intake, eating rate and appetite-related hormones.
a,b, Ad libitum daily energy intake (a, absolute in kcal d−1; b, relative in % of resting energy expenditure) was lower with the HPLC-UPF diet (30% protein and 29% carbohydrates) compared with the NPNC-UPF diet (13% protein and 46% carbohydrates). REE, resting energy expenditure. c, Intake of protein was higher and intake of carbohydrates was lower with the HPLC-UPF compared with the NPNC-UPF, whereas intake of fat and fibre did not differ. d,e, Eating rate (d) and energy intake rate (e) were lower with HPLC-UPF compared with NPNC-UPF (both n = 18). f,g, Bites per meal (f) were lower and chews per bite (g) were higher with HPLC-UPF compared with NPNC-UPF (both n = 18). h, Both diets were rated equally palatable on visual analogue scales (n = 20). i,j, During breakfast on day 5, ghrelin secretion (i) was suppressed, whereas PYY secretion (j) was increased with HPLC-UPF compared with NPNC-UPF (both n = 20). All box plots show the interquartile range with the 25% (lower hinge), 50% (centre line) and 75% (upper hinge) quantiles. Whiskers extend to the minimum and maximum values. For parametric data, the mean is displayed as +. Data in the bar graphs are presented as mean ± s.d. (c). n = 21 unless stated otherwise. P values were from paired two-sided t-tests (af and hj) or Wilcoxon tests (g). iAUC, incremental area under the curve. Source data
Fig. 2
Fig. 2. Diurnal and postprandial glycaemia.
a,b, Diurnal glycaemia (continuous interstitial glucose monitoring) throughout the inpatient intervention (a) was higher with the NPNC-UPF diet (13% protein and 46% carbohydrates) compared with the HPLC-UPF diet (30% protein and 29% carbohydrates), while 24-h-insulin secretion (measured as C-peptide excretion) was higher with HPLC-UPF compared with NPNC-UPF (b). c,d, Following breakfast on day 5, postprandial levels of glucose (c) were similar between interventions, whereas insulin levels (d) were lower with HPLC-UPF compared with NPNC-UPF (both n = 20). e, The molar insulin to glucagon ratio was higher with NPNC-UPF compared with HPLC-UPF (n = 20). All box plots show the interquartile range with the 25% (lower hinge), 50% (centre line) and 75% (upper hinge) quantiles. Whiskers extend to the minimum and maximum values. For parametric data, the mean is displayed as +. Data in diagrams are presented as mean ± s.d. (a and ce). n = 21 unless stated otherwise. P values were from paired two-sided t-tests (ac) or Wilcoxon tests (d and e). tAUC, total area under the curve. Source data
Fig. 3
Fig. 3. Energy expenditure, energy and macronutrient balances and hormones.
a,b, Total energy expenditure (TEE) (a) and sleeping energy expenditure (SEE) (b) were higher with the HPLC-UPF diet (30% protein and 29% carbohydrates) compared with the NPNC-UPF diet (13% protein and 46% carbohydrate). c, Energy balance was lower with HPLC-UPF compared with NPNC-UPF, although positive with both interventions (both P < 0.001). df, Protein balance (d) was more positive with HPLC-UPF compared with NPNC-UPF and carbohydrate balance (e) was similar between interventions, whereas fat balance (f) was positive with NPNC-UPF compared with HPLC-UPF. g, Fuel utilization (macronutrient oxidation in % of 24-h energy expenditure) was lower for carbohydrate and higher for fat and protein with HPLC-UPF compared with NPNC-UPF. Ox, oxidation. h, Fibroblast growth factor 21-secretion (FGF21) was reduced with HPLC-UPF and high with NPNC-UPF and decreased postprandially after breakfast on day 5 with NPNC-UPF (n = 20). i, Glucagon secretion increased postprandially more pronounced with HPLC-UPF compared with NPNC-UPF (n = 20). All box plots show the interquartile range with the 25% (lower hinge), 50% (centre line) and 75% (upper hinge) quantiles. Whiskers extend to the minimum and maximum values. For parametric data, the mean is displayed as +. Data are presented as mean ± s.d. (h and i). n = 21 unless stated otherwise. P values are from paired two-sided t-tests (ac, eg and i) or Wilcoxon tests (d and h). Source data
Extended Data Fig. 1
Extended Data Fig. 1. CONSORT 2010 Participant Flow Diagram.
HPLC, high-protein, lower-carbohydrate diet; NPNC, normal-protein, normal-carbohydrate diet.
Extended Data Fig. 2
Extended Data Fig. 2. Overview of the study design.
Twenty-four healthy young adults participated in a single-blind crossover trial and were randomized to receive either a high-protein, lower-carbohydrate diet (HPLC, 30 % protein, 29 % carbohydrates, CHO) or normal-protein, normal CHO diet (NPNC, 13 % protein, 46 % CHO) for 5.5 days followed by the alternate diet for 5.5 days. Washout between interventions was at least 4 days. Day 1-3 were a run-in period at home with provided foods containing <45 % ultra-processed foods (UPF), whereas days 4-6 comprised a 54-h intervention with >80 % UPF in a whole-room indirect calorimeter (WRIC) at Kiel University. During the inpatient stay, a physical activity level (PAL) of 1.45 was maintained, energy intake and energy expenditure were measured, eating rate was assessed and 24-h urine was collected. On day 5 during breakfast, postprandial blood samples were taken and subjective appetite ratings using visual analogue scales were collected. On day 6 during breakfast, gastric emptying was assessed. Continuous interstitial glucose monitoring was used during the whole study period.
Extended Data Fig. 3
Extended Data Fig. 3. Gastric emptying following an isocaloric test meal using a 13C-breath test.
Gastric emptying was assessed during 4 h following an isocaloric breakfast (porridge, 25 % of individual REE) on day 6 either with a high-protein content (HP-UPF, 30 % protein, 47 % carbohydrates, CHO, 18 % fat, 4 % fibre) or a normal-protein content (NP-UPF,13 % protein, 64 % CHO, 18 % fat, 4 % fibre) of ultra-processed foods (UPF). Percentage 13C-dose recovery per hour (a) was similar for HP-UPF and NP-UPF. Gastric half-emptying time (t1/2, b) was lower with HP-UPF compared to NP-UPF, whereas gastric lag time (tlag, c) was similar for both interventions and the gastric emptying coefficient (GEC, d) was higher for HP-UPF compared to NP-UPF. All box plots show the interquartile range with the 25 % (lower hinge), 50 % (centre line), and 75 % (upper hinge) quantiles. Whiskers extend to the minimum and maximum values. For parametric data, the mean is displayed as +. Data in diagram are presented as mean ± SD (a). N = 20, p-values from paired two-sided t-tests. HPLC, high-protein, lower-carbohydrate diet; NPNC, normal-protein, normal-carbohydrate diet.
Extended Data Fig. 4
Extended Data Fig. 4. Subjective appetite perceptions.
Subjective appetite perceptions were assessed during 3 h following breakfast on day 5 using visual analogue scales. Perceived hunger (a) and desire to eat (DTE, c) after ad libitum energy intake were similar with the high-protein, lower-carbohydrate-ultra-processed food diet (HPLC-UPF, 30 % protein, 29 % carbohydrates, CHO) compared to the normal-protein, normal-carbohydrate diet (NPNC-UPF, 13 % protein, 46 % CHO). Subjective fullness (b, n = 18) was lower and prospective food consumption (PFC, d) was higher with HPLC compared to NPNC. Correspondingly the subjective appetite score (e, mean from ratings of hunger, fullness, desire to eat and prospective food consumption) was higher with HPLC-UPF compared to NPNC-UPF. Data are presented as mean ± SD. N = 19 unless stated otherwise, p-values from paired two-sided t-tests. iAUC, incremental area under the curve.

References

    1. Menichetti, G., Ravandi, B., Mozaffarian, D. & Barabási, A.-L. Machine learning prediction of the degree of food processing. Nat. Commun.14, 2312 (2023). - PMC - PubMed
    1. Monteiro, C. A. et al. Ultra-processed foods: what they are and how to identify them. Public Health Nutr. 22, 936–941 (2019). - PMC - PubMed
    1. Astrup, A. & Monteiro, C. A. Does the concept of “ultra-processed foods” help inform dietary guidelines, beyond conventional classification systems? Debate consensus. Am. J. Clin. Nutr.116, 1489–1491 (2022). - PubMed
    1. Martínez Steele, E., Raubenheimer, D., Simpson, S. J., Baraldi, L. G. & Monteiro, C. A. Ultra-processed foods, protein leverage and energy intake in the USA. Public Health Nutr. 21, 114–124 (2018). - PMC - PubMed
    1. Simpson, S. J. & Raubenheimer, D. Obesity: the protein leverage hypothesis. Obes. Rev.6, 133–142 (2005). - PubMed

Publication types

Associated data