. 2025 May;44(9):2695-2724.
doi: 10.1038/s44318-025-00404-5. Epub 2025 Mar 13.

A versatile toolbox for determining IRES activity in cells and embryonic tissues

Affiliations

A versatile toolbox for determining IRES activity in cells and embryonic tissues

Philipp Koch et al. EMBO J. 2025 May.

Abstract

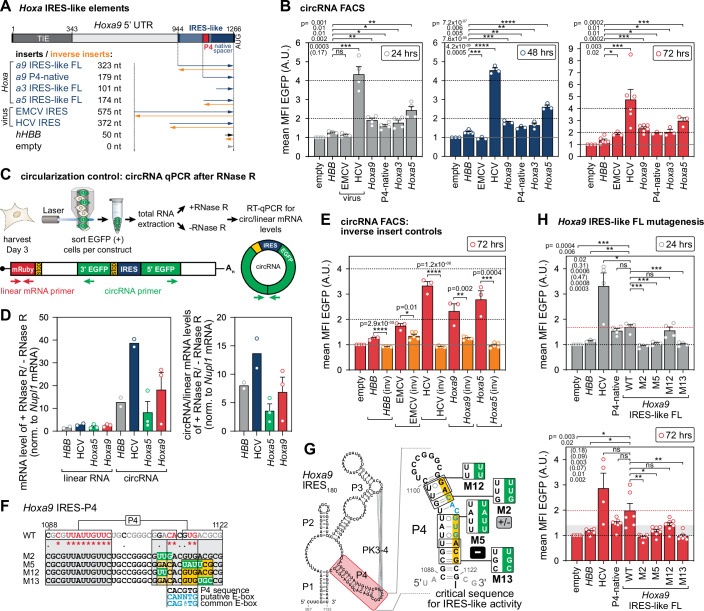
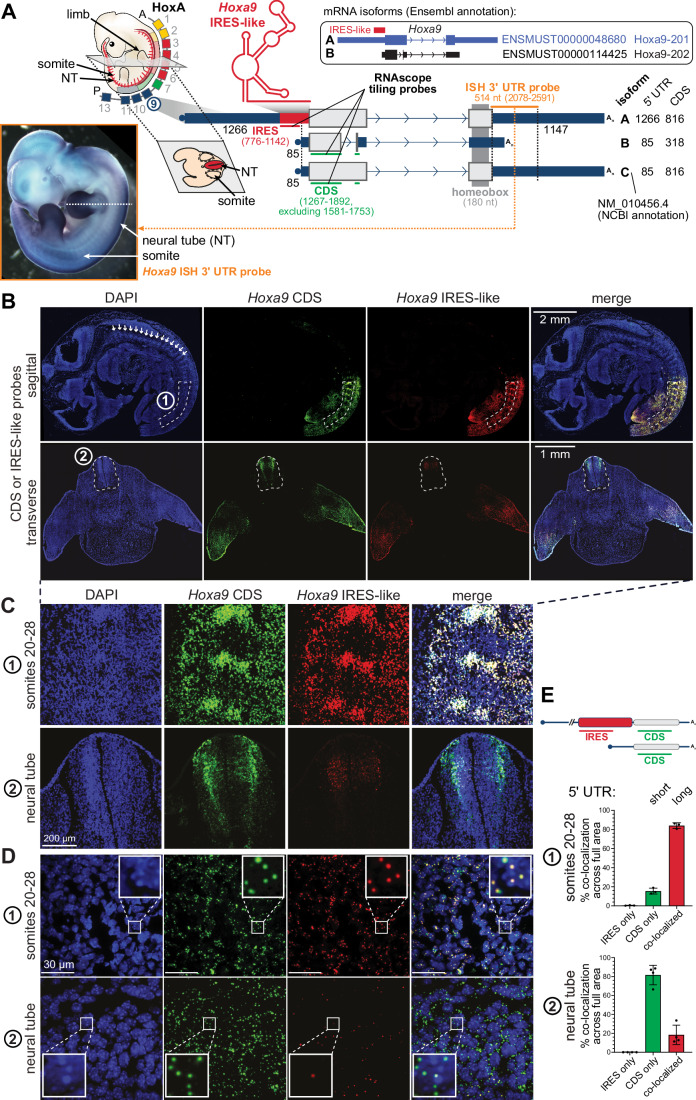
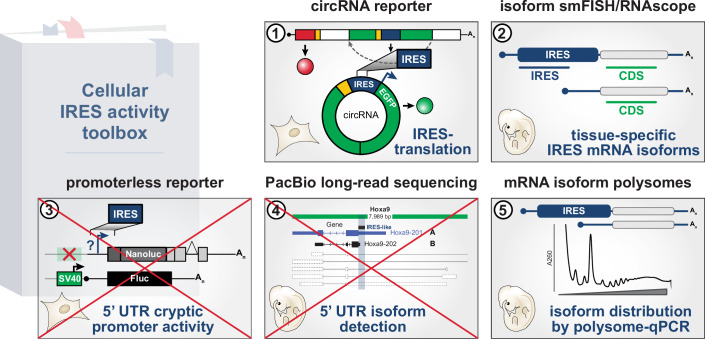
Widespread control of gene expression through translation has emerged as a key level of spatiotemporal regulation of protein expression. A prominent mechanism by which ribosomes can confer gene regulation is via internal ribosomal entry sites (IRESes), whose functions have however, remained difficult to rigorously characterize. Here we present a set of technologies in embryos and cells, including IRES-mediated translation of circular RNA (circRNA) reporters, single-molecule messenger (m)RNA isoform imaging, PacBio long-read sequencing, and isoform-sensitive mRNA quantification along polysome profiles as a new toolbox for understanding IRES regulation. Using these techniques, we investigate a broad range of cellular IRES RNA elements including Hox IRESes. We show IRES-dependent translation in circRNAs, as well as the relative expression, localization, and translation of an IRES-containing mRNA isoform in specific embryonic tissues. We thereby provide a new resource of technologies to elucidate the roles of versatile IRES elements in gene regulation and embryonic development.

Keywords: Embryo Development; Internal Ribosome Entry Site; cellular IRES; mRNA Isoforms; mRNA Translation Regulation.


Conflict of interest statement

Disclosure and competing interests statement. KL and MB are inventors of patents related to the Hoxa9 P4 stem-loop and RNA therapeutics and their various uses. PK, MB, and KL are inventors on a patent related to IRES-like elements in circRNA reporters and RNA therapeutics and their various uses. The remaining authors declare no competing interests.

Figures

Figure 1
Figure 1. Specific IRES activity in an in-cell circRNA reporter system.
(A) Experimental outline of the circRNA reporter assay based on the mRuby-ZKSCAN-split-EGFP plasmid for the screening of IRES activity of the different tested insert sequences, including inverse sequences as controls for circRNA translation activity dependent on insert length and GC-content. Following plasmid transfection, the expression of the reporter system under CMV promoter control leads to the linear pre-mRNA which is circularized through spliceosome-mediated backsplicing (gray box). Cells were harvested after 24 h and 72 h, and their mRuby signal (transfection control) and EGFP signal (readout for IRES activity) was detected. Schematic partially adapted from (Chen et al, 2021). (B) Calculated median fluorescence intensities (MFIs) of EGFP of the mRuby+ subfractions are shown at 24 h and 72 h. Bar graphs are indicating mean values ± SEM, n = 3–6. Empty vector control was normalized to 1; ns not significant. (C) We tested the inverse sequences of active cellular IRESes from (B) as controls for circRNA translation activity dependent on insert length and GC-content, which are identical in the forward and inverse sequences. We did a pairwise comparison of the respective inserts. MFIs of EGFP of the mRuby+ subfractions are shown at 72 h, as presented in (B). Bar graphs are indicating mean values ± SEM, n = 3–6. Empty vector control was normalized to 1. In all figures, data were presented as mean, SD or SEM as stated, and *P ≤ 0.05 was considered significant (ns: P > 0.05; *P ≤ 0.05; **P ≤ 0.01; ***P ≤ 0.001; ****P ≤ 0.0001). Tests, two-tailed unpaired Student’s t test if not stated otherwise, and specific P values used are indicated in the figure or legends. Please see the “Quantification and Statistical Analysis” section in “Methods” for details. We present all exact P values for all bar graphs in the figure. Source data are available online for this figure.
Figure 2
Figure 2. Hoxa IRES-like activity in circRNA reporters.
(A) Experimental outline of the circRNA reporter assay based on the mRuby-ZKSCAN-split-EGFP plasmid for the screening of IRES-like activity of different insert sequences of Hoxa IRES-like elements, as described in Fig. 1A. (B) Calculated MFIs of EGFP of the mRuby+ subfractions are shown at 24 h, 48 h, and 72 h. Bar graphs are indicating mean values ± SEM, n = 3–6. Empty vector control was normalized to 1; ns, not significant. (C) Schematic overview of the procedure to validate the linear and circRNA content of the HEK293T cells post transfection using RNase R digestion followed by RT-qPCR quantification (primers indicated as red and green arrows). Outward-directed circRNA-specific qPCR primers exclusively detect circRNAs. The EGFP primer set only leads to an amplification product after successful backsplicing. (D) The linear and circRNA content of the cells is shown after RNase R digestion relative to undigested samples after normalization to Nupl1 mRNA for each construct. The enrichment of circRNA content over RNase R digestion indicates the successful backsplicing in cells (left). Relative circRNA/linear RNA levels increase upon RNase R digestion after normalization to Nupl1 (right). Bar graphs are indicating mean values ± SEM, n = 2–3. In the case of n = 2, we do not show error bars. (E) We tested the inverse sequences of hHBB, EMCV, HCV, Hoxa9, and Hoxa5 as controls and calculated MFIs of EGFP of the mRuby+ subfractions 72 h as described in Fig. 1C. Bar graphs indicate mean values ± SEM, n = 3–6. Empty vector control was normalized to 1. (F) Substitution mutations were mapped onto the linear P4 sequence (labeled according to conservation) that were tested in the context of the FL Hoxa9 IRES-like element (323 nts). Nts critical for IRES activity are highlighted in yellow, also in (G). Numbers refer to nt positions within the Hoxa9 5’ UTR. The suspected 6-nt putative and common E-box is aligned accordingly (blue). (G) Schematic representation of the mouse Hoxa9 RNA secondary structure model of the 180 nt-long Hoxa9 IRES-like element RNA (Xue et al, 2015) with P4 highlighted (red). The structure model of the P4 stem-loop and disruptive substitution mutations mapped onto the P4 stem are shown. P4 mutants moderately active are labeled “+/–“, and inactive mutants are labeled “–“. M12 and M13 mutants are new. (F, G) Are adapted from (Leppek et al, 2020). (H) Calculated MFIs of EGFP of the mRuby+ subfractions are shown at 24 h and 72 h. Mutants (M2, M5, M12, M13) are tested against the FL IRES-like Hoxa9 WT sequence. Bar graphs are indicating mean values ± SEM, n = 4–7. Empty vector control was normalized to 1. Source data are available online for this figure.
Figure 3
Figure 3. Tissue-specific Hoxa9 mRNA isoform expression in the mouse embryo by smFISH.
(A) Model depicting the expression pattern of the HoxA cluster genes in mouse embryos. The Hoxa9 gene is expressed in posterior somites and the neural tube (NT), and can be expressed in mRNA isoforms with either a long 5’ UTR and full CDS (isoform A; ENSMUST00000048680.8) or short 5’ UTR and truncated CDS (isoform B; ENSMUST00000114425.3), as annotated in mouse GENCODE release M32 (GRCm39). A third mRNA isoform C is annotated in NCBI to contain the short 5’ UTR and the full CDS (NM_010456.4). Functional RNA elements in the mRNA 5’ UTR include an IRES-like element (Xue et al, 2015). IRES, internal ribosome entry site. Regions targeted by smFISH probes are indicated as “IRES” and “CDS” with the respective coordinates of the ENSEMBL-annotated isoforms. Insert: Whole-mount in situ hybridization (ISH) of a representative WT stage E11.5 embryo using a Hoxa9 probe targeting the 3’ UTR region as annotated in the gene model (orange). The dashed white line indicates the position of the transverse section used for smFISH in (B). (B) Representative images of E11 mouse embryo sections immunostained with DAPI (blue), the Hoxa9 CDS probe (green), the Hoxa9 IRES-like probe (red) and the 3-plex Negative Control probes (white). Boxed regions #1 and #2 indicate the regions for which quantifications were performed shown in (D, E). White arrows point to individual somites. (C, D) Representative zoomed-in views of the numbered boxes in (B). #1 represents somites 20–28 and #2 represents the anterior NT. The scale bars indicate the different magnifications in (C, D). (E) Quantification of the proportion of the long and short 5’ UTR isoforms in the respective regions from (D) as indicated by dotted lines in (B). Colocalized CDS and IRES-like probe signals represent the long 5’ UTR isoform, whereas the non-colocalized CDS-only probe signals represent the short 5’ UTR isoform. IRES-only signal is not detected at a biologically relevant level. Bar graphs indicate mean values ± SD, n = 3–4 embryos (somites n = 3; neural tube n = 4). Source data are available online for this figure.
Figure 4
Figure 4. Cryptic promoter activity from IRES element DNA in promoterless reporters is not relevant for IRES mRNA element function.
(A) Schematic of the SV40 promoter-driven Nanoluciferase (Nluc) reporter ORF (621 nt) attached to an N-terminal 3xHA tag, the Nluc-β-globin (NLB) reporter of Nluc fused to an intron-containing rabbit β-globin gene that leads to the NLB fusion protein, and the control Firefly (Fluc) reporter with the calculated molecular weight of their encoded protein in kilo Dalton (kDa). mRNA reporters contain hHBB as a control 5’ UTR. IRES-like elements were introduced into the Nluc 5’ UTR instead of hHBB. The Fluc reporter mRNA with the hHBB 5’ UTR serves as an internal transfection control from a separate plasmid. See also Fig. EV5. (B) Reporter plasmids were transiently transfected into mouse C3H/10T1/2 cells. Relative luciferase activity is expressed as a Nluc/Fluc ratio. Average luciferase activity ± standard error of the mean (SEM), n = 5; NLB was normalized to 1; A.U. arbitrary units. (C) Schematic of the topology of regulatory elements in the mouse Hoxa9 5’ UTR and promoterless reporter assay design. The 323 nt-long Hoxa9 FL IRES-like RNA element (a9 IRES-like FL) harbors the P4 stem-loop. Cryptic promoter activity from Hoxa IRES-like elements (a3, a5, a9) is tested by inserting FL IRES-like elements upstream NLB in a plasmid lacking the SV40 promoter (ΔSV40). Viral IRES controls (EMCV, HCV), an empty vector control (empty; no insert in the 5’ UTR region), and control 5’ UTR (hHBB) were included. A co-transfected control reporter (hHBB-Fluc) under an active SV40 promoter served as reference. Cryptic transcription from the promoterless plasmids will lead to unclear 5’ ends and 5’-shortened 5’ UTR fragments. (D) Normalized Nluc mRNA levels from promoterless NLB constructs were measured in transiently plasmid-transfected C3H/10T1/2 cells as in (B). Cells from the same transfection were split in half for mRNA (D) and protein (E) analysis. Average Nluc mRNA levels are expressed as respective globin/NupL1 mRNA levels ± SEM, n = 2–7. Promoter-containing plasmids ( + SV40) of empty and hHBB inserts served as expression controls. Empty and hHBB 5’ UTR serve as negative controls for ΔSV40 constructs; +SV40-hHBB was normalized to 1. In the case of n = 2 we do not show an error bar nor P value. (E) Normalized Nluc/Fluc luciferase activity from promoterless constructs was measured from samples according to (D) and as described in (B). Average luciferase activity ± SEM, n = 4–8; +SV40-hHBB was normalized to 1; ns not significant. (F) Control assay with SV40+ promoter reporters. In analogy to (C), regular SV40 promoter activity with Hoxa IRES-like elements (a3, a5, a9) by inserting FL IRES-like elements upstream NLB in a plasmid with the SV40 promoter (+ SV40). Transcription from the SV40 promoter will yield FL 5’ UTRs as annotated. Capped mRNAs containing IRES-like elements as sole 5’ UTRs will contain upstream AUGs (uAUGs), uORFs, and out-of-frame uAUGs (red) that will reduce translation from the main ORF. In-frame uAUGs (green) will contribute to translation from the main AUG. (G) Normalized Nluc mRNA levels from +SV40 promoter NLB constructs were measured in transiently plasmid-transfected C3H/10T1/2 cells as in (B). Cells from the same transfection were split in half for mRNA (G) and protein (H) analysis. Average Nluc mRNA levels are expressed as respective globin/actin mRNA levels ± SEM, n = 3–4. Empty and hHBB 5’ UTR serve as controls; +SV40-hHBB was normalized to 1. For all pairwise comparisons, the P values are not significant (ns). (H) Normalized Nluc/Fluc luciferase activity from promoterless constructs was measured from samples in (G) and as described in (B). Average luciferase activity ± SEM, n = 3–4; +SV40-hHBB was normalized to 1. Source data are available online for this figure.
Figure 5
Figure 5. Hoxa9 and Hoxa10 mRNA expression in mouse embryo tissues by PacBio HiFi sequencing and Hoxa9 mRNA abundance and translation in embryonic tissues.
(A) Illustration of a genome browser snapshot showing the transcript models predicted by IsoQuant, NCBI RefSeq, and corrected HiFi reads from the IsoQuant output around Hoxa9 and Hoxa10 loci (chr6:52,200,050-52,217,850). The 5’ UTR IRES-like element is indicated by the red box. Despite 5’ UTR truncations, reads of identical intron chains as in isoform A were assigned to the Hoxa9-201 IRES-containing reference transcript. Similarly, reads of identical intron chains as in isoform B but with an extended 3’ UTR were assigned to Hoxa9-202. Only two novel transcripts were detected for the Hoxa10 gene. The previously reported Hoxa9/Mir196b fusion transcript is similar to Hoxa9-204 with a truncated 5’ UTR. Otherwise, there was no novel isoform identified that indicates any fusion transcripts. The full list of the corrected reads is shown in Appendix Figs. S1 and 2. (B) Schematic of Hoxa9 mRNA amplicons used for RT-qPCR analysis. The IRES1, IRES2, IRES3, IRES4, and CDS2 amplicons are the same as in (Ivanov et al, 2022) and (Leppek et al, 2020). In addition, we created new primer sets to amplify an upstream coding sequence region within exon 1 (CDS 5’) and the 85 nt directly 5’ to the start codon (85 nt 5’ UTR). The latter is contained within the IRES-like region (Akirtava et al, 2022) which was putatively defined as the entire Hoxa9 5’ UTR sequence. The CDS2 amplicon within the coding region spans an exon–exon junction. (C) RT-qPCR results from micro-dissected E11.5 mouse embryonic tissue mRNA. Values shown are the difference in Ct values between tissue samples (three biological replicates each) and a respective no-RT control. Error bars are SD, n = 3. (D) RT-qPCR results using 0.1 fg of a plasmid containing the Hoxa9 IRES-like element and CDS as a template. Values shown are the difference in Ct values between DNA samples (n = 2) and a no-RT control as in (C). (E) Representative sucrose gradient fractionation trace from a E11.5 neural tube and somite sample (C) and quantification of the fraction of total mRNA found in each of the five portions of the gradient, as demarcated in the schematic. (F) Three biological replicates were performed, and the values for each Hoxa9 mRNA (ENSMUST00000048680) amplicon are shown as mean +/− SEM, n = 3. qPCR amplicons correspond to as illustrated in (B). For comparison, a highly translated housekeeping mRNA, Nupl1 (ENSMUST00000225805), is also shown (dotted black line), as well as the respective mRNA ORF lengths. Source data are available online for this figure.
Figure 6
Figure 6. A versatile toolbox to determine IRES activity in cells and embryonic tissues.
Schematic summary of the presented technologies as a toolbox for investigation and functional characterization of cellular IRES activity.
Figure EV1
Figure EV1. FACS Gating Scheme for circRNA plasmid-derived EGFP assays.
(A) Schematic overview of the raw FACS data processing pipeline including: initial quality control (to exclude low-quality data derived from cells measured after a clogging event of the FACS machine), identification of viable cells and singlets, identification of transfected cells (based on the positive mRuby signal), and final measurement of the EGFP signal of the mRuby+ subfraction. (B) EGFP signals of the mRuby+ subfraction of cells representatively shown as histograms for one experiment for each observed time point (left panels) and overlayed histograms of the EGFP and mRuby signal of the mRuby+ subfraction of cells (right panels), colorized according to the tested sample sequences according to Fig. EV1C. (C) Cell numbers of the mRuby+ cell fractions of the indicated samples shown for one representative experiment per time point. (D) EGFP signals of the mRuby+ subfraction of cells representatively shown as histograms for one experiment for each observed time point (left panels) and overlayed histograms of the EGFP and mRuby signal of the mRuby+ subfraction of cells (right panels), colorized according to the tested sample sequences according to Fig. EV1E. (E) Cell numbers of the mRuby+ cell fractions of the indicated samples shown for one representative experiment per time point.
Figure EV2
Figure EV2. Schematic of IRES-like elements for circRNA plasmid-derived EGFP assays and annotated uAUGs.
(A) Schematic of the circRNA reporter assay based on the mRuby-ZKSCAN-split-EGFP plasmid for the screening of IRES-like activity of the different tested insert sequences, with annotated out-of-frame upstream (u)AUGs/uORFs (red) and overlapping ORFs (oORF, asterisks), and in-frame uAUGs (green) mapped onto the IRES-like sequences (adapted from Fig. 1A). (B) Schematic of different tested insert sequences as in (A) for the Hoxa cluster IRES-like elements, with annotated out-of-frame uAUGs/uORFs (red), and in-frame uAUGs (green) mapped onto the IRES-like sequences (adapted from Fig. 2A).
Figure EV3
Figure EV3. circRNA detection after plasmid transfection, RNase R cleanup and RT-qPCR.
(A) Calculated median fluorescence intensities (MFIs) of the mRuby+ subfractions are shown after normalization to the empty vector control in dependency of the tested insert sequences 120 h post transfection. Bar graphs are indicating mean values ± SEM, n = 4. See also Fig. 2B. (B) Experimental outline to proof the circRNA content of the HEK293T cells, generated by spliceosome-mediated backsplicing, after plasmid DNA transfection in order to validate the origin of the observed EGFP signal. Transfected cells were harvested 5 days post transfection and FACS-sorted according to their mRuby/EGFP signal. Afterwards, total RNA extraction was performed on the double positive cell fraction and subsequently digested with RNase R (1 U/µg RNA) for 30 min at 37 °C. The negative control was incubated with RNase R reaction buffer. qPCR was used for final circRNA quantification. EGFP primer will only lead to a product of 94 nt length after successful backsplicing. The 115 nt-long mRuby product was used for linear pre-mRNA quantification. The enrichment of circRNA over the RNase R digestion is shown in Fig. 2D. (C) Cell numbers of the EGFP+ cell fractions of the indicated samples shown for the n = 2–3 experiments used for RNase R-qPCR. (D) Calculated median fluorescence intensities (MFIs) of the mRuby+ subfractions are shown after normalization to the empty vector control in dependency of the tested insert sequences 24 h post transfection. Bar graphs are indicating mean values ± SEM, n = 4. See also Fig. 2E. Source data are available online for this figure.
Figure EV4
Figure EV4. Low background is observed for smFISH with control probes.
Representative images of the E11 mouse embryo sagittal sections stained with commercially available RNAscope Negative Control Probes targeting the DapB gene. Low background is observed in the channels used for visualizing Hoxa9 CDS and IRES-like regions. This control probe staining was performed in parallel to the specific probe staining Fig. 3B in the same experiment but Fig. 3B and the panel shown here represent different embryo sections.
Figure EV5
Figure EV5. ESMFold structure prediction of the NLB reporter fusion protein.
(A) For comparison, the crystal structure of shrimp Nanoluc (Nluc, PDB: 5IBO) and chain B of rabbit hemoglobin (PDB: 2RAO) are shown, in dark and light gray, respectively. Nluc and rabbit hemoglobin fold into a β-barrel and a globular fold, respectively, of similar size. (B) ESMFold, a large language model for protein structure prediction with evolutionary information (Lin et al, 2023), yields a high confidence prediction of the structure of the designed NLB reporter (average per-residue model confidence score plddt of 0.78). Structure prediction of the fusion protein NLB with the flexible 3xHA tag and interdomain linker reveals that both Nluc and β-globin can adopt their native folds, with a less compact thus less stable fold of the Nluc β-barrel, while the flexible linker and N-terminal 3xHA tag are unstructured. Predicted structure is colored by the model confidence. (C) Crystal structures aligned to the respective domains in the NLB reporter and the root-mean-square deviation (RMSD) for each of them are provided. The alignment of the predicted NLB fusion protein with the individual crystal structures reveals that in the fusion protein, the β-barrel of the Nluc is less compact in the fusion protein, suggesting that the fold is less stable within the proposed construct. Given that the luciferase activity of Nluc is tightly linked to substrate oxidation in its central cavity for luminescence (Tomabechi et al, 2016), this effect on the native Nluc folding state may explain the reduced activity of NLB.

References

    1. Akirtava C, May GE, McManus CJ (2022) False-positive IRESes from Hoxa9 and other genes resulting from errors in mammalian 5’ UTR annotations. Proc Natl Acad Sci USA 119:e2122170119 - PMC - PubMed
    1. Babendure JR, Babendure JL, Ding J-H, Tsien RY (2006) Control of mammalian translation by mRNA structure near caps. RNA 12:851–861 - PMC - PubMed
    1. Brito Querido J, Díaz-López I, Ramakrishnan V (2023) The molecular basis of translation initiation and its regulation in eukaryotes. Nat Rev Mol Cell Biol 25:168–186 - PubMed
    1. Burke AC, Nelson CE, Morgan BA, Tabin C (1995) Hox genes and the evolution of vertebrate axial morphology. Development 121:333–346 - PubMed
    1. Burke TW, Kadonaga JT (1996) Drosophila TFIID binds to a conserved downstream basal promoter element that is present in many TATA-box-deficient promoters. Genes Dev 10:711–724 - PubMed

LinkOut - more resources