. 2025 Mar 13;22(1):80.
doi: 10.1186/s12974-025-03407-5.

Target inhibition of SPAK in choroid plexus attenuates T cell infiltration and demyelination in experimental autoimmune encephalomyelitis

Affiliations

Target inhibition of SPAK in choroid plexus attenuates T cell infiltration and demyelination in experimental autoimmune encephalomyelitis

Chenxing Qi et al. J Neuroinflammation. .

Abstract

Background: Disease-modifying therapies (DMTs) that prevent immune cell infiltration into the brain have demonstrated efficacy in multiple sclerosis (MS) treatment. However, their unpredictable adverse effects necessitate the development of safer therapeutic alternatives. The choroid plexus (ChP) functions as a crucial barrier against immune cell invasion, and previous studies have shown that preventing immune cell infiltration across the ChP reduces brain lesion in MS animal models. Understanding ChP barrier regulation is therefore essential for identifying novel therapeutic targets for MS. Here, we explored the role of Ste20-related proline/alanine-rich kinase (SPAK) in experimental autoimmune encephalomyelitis (EAE).

Methods: We examined the expression patterns of SPAK signaling in ChP using immunofluorescence in the EAE model. To investigate the roles of SPAK, matrix metalloproteinase (MMP) 2 and MMP9 in EAE pathology, we performed ChP-specific gene manipulation via intracerebroventricular (ICV) injection of recombinant adeno-associated virus 2/5 (rAAV2/5). T cell infiltration into the central nervous system (CNS) was analyzed using CD4 immunostaining and flow cytometry. We employed cell immunofluorescence, transwell assays, and rescue experiments in vitro to study SPAK's effects on ChP epithelial barrier integrity. We also evaluated the protective effects of SPAK-Na-K-2Cl cotransporter-1 (NKCC1) inhibitors (ZT-1a and bumetanide) on immune invasion and demyelination during EAE using pharmacological approaches.

Results: Following EAE induction, we observed progressive increases in both total and phosphorylated SPAK levels in ChP epithelium. Notably, ChP-specific SPAK knockdown significantly reduced T cell invasion and ameliorated EAE pathology, while SPAK overexpression exacerbated these effects. Bulk RNA sequencing and subsequent qPCR validation revealed that SPAK knockdown decreased the expression of MMP2 and MMP9, MMPs that compromise barrier integrity by degrading tight junction proteins. In vitro studies demonstrated that SPAK overexpression impaired ChP barrier function through the activator protein-1 (AP-1)-MMP2/9-zonula occludens-1 (ZO-1) axis. Furthermore, ChP-specific knockdown of either MMP2 or MMP9 protected against EAE pathology. Additionally, we identified SPAK-NKCC1 antagonists (bumetanide and ZT-1a) as promising therapeutic candidates for MS/EAE treatment.

Conclusions: Our findings demonstrate that targeting ChP-SPAK signaling represents a novel therapeutic strategy for MS treatment.

Keywords: Choroid plexus; Experimental autoimmune encephalomyelitis; Multiple sclerosis; SPAK; Tight junctions.


Conflict of interest statement

Declarations. Ethics approval and consent to participate: The study (ethics protocol number: HT-2024-LWFB-0022) was approved by the Animal Care and Use Committee of Zhejiang Huitong Test & Evaluation Technology Group. Consent for publication: Not applicable. Competing interests: The authors declare no competing interests.

Figures

Fig. 1
Fig. 1
Temporal Expression Profile of SPAK-NKCC1 Signaling Components in the ChP During EAE Progression. A. Representative immunofluorescence images of SPAK expression in the ChP at 0-20 days post-EAE induction. Scale bar: 100 μm. B. Quantification of SPAK fluorescence intensity from panel A (n = 5/group). C. Representative immunofluorescence images of p-SPAK in the ChP at 0-20 days following EAE induction. Scale bar: 100 μm. D. Quantification of p-SPAK fluorescence intensity from panel C (n = 5/group). E. Representative immunofluorescence images of p-NKCC1 in the ChP at 0-20 days post-EAE induction. Scale bar: 100 μm. F. Quantification of p-NKCC1 fluorescence intensity from panel E. G-H. Representative Western blots and quantification of SPAK protein levels in ChP lysates at 0-20 days post-EAE induction (n = 4/group). I-J. Representative Western blots and quantification of p-SPAK protein levels in ChP lysates at 0-20 days post-EAE induction (n = 4/group). K-L. Representative Western blots and quantification of p-NKCC1 protein levels in ChP lysates at 0-20 days following EAE induction (n = 4/group). All quantitative data were analyzed using one-way ANOVA with Dunnett’s multiple comparisons test. Data are presented as mean ± SEM.* P < 0.05, ** P < 0.01, *** P < 0.001. ChP: choroid plexus
Fig. 2
Fig. 2
ChP-Specific SPAK Knockdown Ameliorates EAE Pathology. A. Schematic timeline of experimental design for investigating ChP-specific SPAK-Kd effects in the EAE model. B. Representative immunofluorescence images showing EGFP expression confined to the ChP 14 days after ICV injection of scramble or SPAK-Kd virus. C. Quantification of SPAK fluorescence intensity from panel B (n = 5/group). D. Clinical disease scores show attenuated EAE severity in ChP SPAK-Kd mice compared to controls (n = 7/group). Analysis by two-way RM ANOVA with Sidak’s multiple comparisons test. E. Representative immunostaining of myelin (MBP) and neuronal (NF-H) markers in spinal cord sections from scramble and SPAK-Kd mice at day 21 following EAE induction. Scale bar: 100 μm. F. Quantification of MBP coverage from panel E (n = 5/group). G. Representative co-immunostaining of microglial markers Iba1 and CD68 in spinal cord sections from scramble and SPAK-Kd mice at day 14 post-EAE induction. Scale bar: 100 μm. H. Quantification of Iba1+/CD68+ double-positive microglia from panel G (n = 5/group). I. Three-dimensional reconstruction of microglial morphology in spinal cords at day 14 post-EAE induction. J-L. Morphometric analysis of microglia from panel I: cell diameter (J), branch points (K), and dendritic length (L) (n = 30 cells/group). M. Representative CD4 immunostaining in ChP tissue at day 14 following EAE induction. Scale bar: 100 μm. N. Quantification of CD4+ T cells from panel M (n = 5/group). O. Representative H&E staining of spinal cord sections from scramble and SPAK-Kd mice at day 14 post-EAE induction. Scale bar: 100 μm. P. Quantification of immune cell infiltration from panel O (n = 5/group). Q. Representative CD4 immunostaining in spinal cords at day 14 following EAE induction. Scale bar: 100 μm. R. Quantification of CD4+ T cells from panel Q (n = 5/group). Statistical analyses performed using unpaired t-test unless otherwise specified. Data are presented as mean ± SEM. ###P < 0.001, * P < 0.05, ** P < 0.01, *** P < 0.001. ChP: choroid plexus
Fig. 3
Fig. 3
ChP-Specific SPAK Knockdown Reduces CNS Infiltration of CD4+ T Cell Subsets. A. Representative FCM plots showing CD4+, Th1+, and Th17+ T cell populations in CSF at day 14 post-immunization in scramble and ChP-specific SPAK-Kd mice. B-D. Quantitative analysis of CSF FCM data showing reduced infiltration of CD4+ (B), Th1+ (C), and Th17+ (D) T cells following ChP-specific SPAK-Kd (n = 5/group). E. FCM analysis of CD4+, Th1+, and Th17+ T cell populations in spinal cords at day 14 post-immunization in scramble and ChP-specific SPAK-Kd mice. F-H. Quantitative analysis of spinal cords FCM data showing reduced infiltration of CD4+ (F), Th1+ (G), and Th17+ (H) T cells at day 14 post-immunization (n = 5/group). Statistical analyses performed using unpaired t-test. Data are presented as mean ± SEM. * P < 0.05, ** P < 0.01. ChP: choroid plexus
Fig. 4
Fig. 4
ChP-Specific SPAK Overexpression Exacerbates EAE Pathology. A. Schematic timeline of experimental design for investigating ChP-specific SPAK-OE effects in the EAE model. B. Representative immunofluorescence images showing SPAK expression in the ChP 14 days after ICV injection of control or SPAK-OE virus. C. Quantification of SPAK fluorescence intensity from panel B (n = 5/group). D. Clinical disease scores demonstrating enhanced EAE severity in ChP SPAK-OE mice compared to controls (n = 7/group). Analysis by two-way RM ANOVA with Sidak’s multiple comparisons test. E. Representative immunostaining of myelin (MBP) and neuronal (NF-H) markers in spinal cord sections from control and SPAK-OE mice at day 21 post-EAE induction. Scale bar: 100 μm. F. Quantification of MBP coverage from panel E (n = 5/group). G. Representative H&E staining of spinal cord sections at day 14 following EAE induction. Scale bar: 100 μm. H. Quantification of immune cell infiltration from panel G. I. Representative co-immunostaining of microglial markers Iba1 and CD68 in spinal cords at day 14 post-EAE induction. Scale bar: 100 μm. J. Quantification of Iba1+/CD68+ double-positive microglia from panel I (n = 5/group). K. Representative CD4 immunostaining in ChP tissue at day 14 post-EAE induction from control and SPAK-OE mice. Scale bar: 100 μm. L. Quantification of CD4+ T cells from panel K (n = 5/group). Statistical analyses performed using unpaired t-test unless otherwise specified. Data are presented as mean ± SEM. #P < 0.05, * P < 0.05, ** P < 0.01, *** P < 0.001. ChP: choroid plexus
Fig. 5
Fig. 5
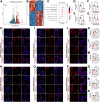
SPAK Signaling Modulates MMP and ZO-1 Expression in ChP Epithelium. A. Volcano plot analysis of DEGs in the ChP following SPAK-Kd at day 14 post-EAE induction, determined by bulk RNA-seq (n = 5/group). B. Heatmap depicting the Top 50 DEGs identified from RNA-seq analysis. C. GO enrichment analysis of identified DEGs. D-E. The qPCR validation of RNA-seq results showing expression of mmp2 (D) and mmp9 (E) at day 14 post-EAE induction (n = 5/group). F-G. The qPCR analysis of mmp2 (F) and mmp9 (G) expression in the ChP of non-EAE mice 14 days after SPAK-Kd or scramble virus injection (n = 5/group). H-J. Representative immunofluorescence images showing expression of MMP2 (H), MMP9 (I), and ZO-1 (J) in the ChP at day 14 post-EAE induction across treatment groups: untreated, control, SPAK-Kd, and SPAK-OE. Scale bars: 100 μm, 50 μm, 25 μm. K-M. Quantification of fluorescence intensity for MMP2 (K), MMP9 (L), and ZO-1 (M) from panels H-J. N-P. Representative immunofluorescence images showing expressions of MMP2 (N), MMP9 (O), and ZO-1 (P) in the ChP of non-EAE mice at day 14 across treatment groups. Scale bars: 100 μm, 50 μm, 25 μm. Q-S. Quantitative analysis of fluorescence intensity for MMP2 (Q), MMP9 (R), and ZO-1 (S) from panels N-P (n = 5/group). Statistical analyses performed using unpaired t-test or one-way ANOVA with Tukey’s multiple comparisons test as indicated. Data are presented as mean ± SEM. * P < 0.05, ** P < 0.01, *** P < 0.001. ChP: choroid plexus; dpi: day post immunization
Fig. 6
Fig. 6
SPAK Modulates ChP Barrier Integrity via the AP-1-MMP2/9-ZO1 Signaling Axis. A. Representative EGFP fluorescence images confirming stable expression of SPAK-OE or empty vector control in Z310 cells. Scale bar: 100 μm. B. Representative immunofluorescence images showing reduced ZO-1 expression in SPAK-OE Z310 cells. Scale bar: 50 μm. C. Quantification of ZO-1 fluorescence intensity (n = 5/group). D-E. The qPCR analysis confirming knockdown efficiency of mmp2 (D) and mmp9 (E) in siRNA-transfected Z310 cells (n = 5/group). F. Representative immunofluorescence images showing partial restoration of ZO-1 expression following MMP2/9 knockdown. Scale bar: 50 μm. G. Quantification of ZO-1 fluorescence intensity (n = 5/group). H-K. Western blot analysis of AP-1 components in control and SPAK-OE Z310 cells: Representative immunoblots (H) and quantification of c-Fos (I); Representative immunoblots (J) and quantification of c-Jun (K) (n = 5/group). L. Representative immunofluorescence images showing partial rescue of ZO-1 expression in SPAK-OE cells treated with AP-1 inhibitor SR110302 (1 µM). Scale bar: 50 μm. M. Quantification of ZO-1 fluorescence intensity (n = 5/group). N-Q. ELISA quantification of secreted MMPs: MMP2 (N) and MMP9 (O) levels in control vs. SPAK-OE cell; MMP2 (P) and MMP9 (Q) levels following AP-1 inhibitor treatment (n = 5/group). R-S. Quantification of T cell migration in transwell assays showing enhanced migration with SPAK-OE and partial rescue by MMP2/9 siRNAs and SR110302 treatment (n = 5/group). Statistical analyses performed using unpaired t-test or one-way ANOVA with Tukey’s multiple comparisons test as indicated. Data are presented as mean ± SEM. ns: non-significant, * P < 0.05, ** P < 0.01, *** P < 0.001. ChP: choroid plexus
Fig. 7
Fig. 7
ChP-Specific Knockdown of MMP2/9 Attenuates EAE Pathology. A. Schematic timeline of the experimental design for evaluating the effects of ChP-specific knockdown of MMP2 (MMP2-Kd) and MMP9 (MMP9-Kd) in the EAE model. B-C. The qPCR analysis confirmed significant reductions in mmp2 (B) and mmp9 (C) mRNA expression levels in the ChP of MMP2-Kd and MMP9-Kd mice, respectively, 14 days following ICV injection (n = 5/group). Statistical analysis by unpaired t-test. D. Clinical disease scores showing reduced EAE severity in MMP2-Kd and MMP9-Kd mice compared to controls (n = 7/group). Statistical analysis by two-way RM ANOVA with Sidak’s multiple comparisons test. E. Representative immunofluorescence images showing ZO-1 expression in the ChP at day 14 post-EAE induction across treatment groups: untreated, scramble, MMP2-Kd, and MMP9-Kd. Scale bar: 50 μm. F. Quantification of ZO-1 fluorescence intensity from panel E (n = 5/group). Statistical analysis by one-way ANOVA with Tukey’s multiple comparisons test. G. Representative immunostaining of myelin (MBP) and neuronal (NF-H) markers in spinal cord sections from untreated, scramble, MMP2-Kd, and MMP-Kd mice at day 21 post-EAE induction. Scale bar: 100 μm. H. Quantification of MBP coverage in spinal cords from panel G (n = 5/group). Statistical analysis by one-way ANOVA with Tukey’s multiple comparisons test. I. Representative H&E staining of spinal cord sections at day 14 post-EAE induction across treatment groups: untreated, scramble, MMP2-Kd, and MMP9-Kd. Scale bar: 100 μm. J. Quantification of immune cell infiltration identified in panel I (n = 5/group). One-way ANOVA with Tukey’s multiple comparisons test. K. Representative co-immunostaining of microglial markers Iba1 and CD68 in spinal cord sections at day 14 post-EAE induction across treatment groups. Scale bar: 100 μm. L. Quantification of Iba1+/CD68+ double-positive microglial cells from panel K (n = 5/group). One-way ANOVA with Tukey’s multiple comparisons test. M. CD4 immunostaining in ChP tissues at day 14 post-EAE induction across treatment groups: untreated, scramble, MMP2-Kd, and MMP9-Kd. Scale bar: 100 μm. N. Quantification of CD4+ T cells from panel M (n = 5/group). One-way ANOVA with Tukey’s multiple comparisons test. O. Representative CD4 immunostaining in spinal cord sections at day 14 post-EAE induction across treatment groups: untreated, control, MMP2-Kd, and MMP9-Kd. Scale bar: 100 μm. P. Quantification of CD4+ T cells in spinal cords from panel O (n = 5/group). One-way ANOVA with Tukey’s multiple comparisons test. Data are presented as mean ± SEM. ###P < 0.001, * P < 0.05, ** P < 0.01, *** P < 0.001. ChP: choroid plexus
Fig. 8
Fig. 8
SPAK Inhibition by ZT-1a Demonstrates Protective Effects against EAE Pathology. A. Schematic timeline of experimental design for investigating ZT-1a treatment effects in the EAE model. B. Clinical disease scores demonstrating reduced EAE severity in ZT-1a-treated mice compared to vehicle controls (n = 7/group). Analysis by two-way RM ANOVA with Sidak’s multiple comparisons test. C. Representative immunostaining of myelin (MBP) and neuronal (NF-H) markers in spinal cord sections from vehicle- and ZT-1a-treate mice at day 21 following EAE induction. Scale bar: 100 μm. D. Quantification of MBP coverage from panel C (n = 5/group). E. H&E staining of spinal cord sections at day 14 post-EAE induction. Scale bar: 100 μm. F. Quantification of immune cell infiltration from panel E (n = 5/group). G. Representative co-immunostaining of microglial markers Iba1 and CD68 in spinal cords at day 14 following EAE induction. Scale bar: 100 μm. H. Quantification of Iba1+/CD68+ double-positive microglia from panel G (n = 5/group). I. Three-dimensional reconstruction of microglial morphology in spinal cords at day 14 post-EAE induction. J-L. Morphometric analysis of microglia: cell diameter (J), branch points (K), and dendritic length (L) from panel I (n = 30 cells/group). M. Representative CD4 immunostaining in ChP tissues at day 14 following EAE induction. Scale bar: 100 μm. N. Quantification of CD4+ T cells from panel M (n = 5/group). O. Representative CD4 immunostaining in spinal cords at day 14 post-EAE induction. Scale bar: 100 μm. P. Quantification of CD4+ T cells from panel O (n = 5/group). Statistical analyses performed using unpaired t-test unless otherwise specified. Data are presented as mean ± SEM. ###P < 0.001, * P < 0.05, ** P < 0.01, *** P < 0.001. i.p.: intraperitoneal, ChP: choroid plexus
Fig. 9
Fig. 9
SPAK Inhibition by ZT-1a Reduces CNS Infiltration of CD4+ T Cell Subsets. A. Representative FCM plots showing CD4+, Th1+, and Th17+ T cell populations in CSF at day 14 post-EAE induction in vehicle- and ZT-1a-treated mice. B-D. Quantitative analysis of CSF FCM data demonstrating reduced infiltration of CD4+ (B), Th1+ (C), and Th17+ (D) T cells following ZT-1a treatment (n = 5/group). E. FCM analysis of CD4+, Th1+, and Th17+ T cell populations in spinal cords at day 14 post-EAE induction in vehicle- and ZT-1a-treated mice. F-H. Quantitative analysis of spinal cords FCM data demonstrating reduced infiltration of CD4+ (F), Th1+ (G), and Th17+ (H) T cells following ZT-1a treatment (n = 5/group). Statistical analyses performed using unpaired t-test. Data are presented as mean ± SEM. * P < 0.05, ** P < 0.01, *** P < 0.001. ChP: choroid plexus
Fig. 10
Fig. 10
ICV Administration of Bumetanide Ameliorates EAE Pathology. A. Clinical disease scores showing no effect of intraperitoneal bumetanide administration (n = 7/group). Analysis by two-way repeated measures ANOVA with Sidak’s multiple comparisons test. B. Schematic timeline of experimental design for evaluating bumetanide treatment effects in the EAE model. C. Clinical scores demonstrated reduced EAE severity with daily ICV bumetanide administration (n = 7/group). Two-way RM ANOVA with Sidak’s multiple comparisons test. D. Representative immunostaining of MBP in spinal cord sections from control and bumetanide-treated mice. Scale bar: 100 μm. E. Quantification of MBP coverage (n = 5/group). Unpaired t-test. F. Representative CD4 immunostaining in ChP tissue at day 14 post-EAE induction. Scale bar: 100 μm. G. Quantification of CD4+ T cells (n = 5/group). Unpaired t-test. H. Clinical disease scores showing reduced EAE severity with ICV bumetanide administration during days 8-14 post-EAE induction (n = 7/group). Two-way RM ANOVA with Sidak’s multiple comparisons test. I-J. ICV injection of bumetanide administered during days 8-14 post-EAE induction significantly reduces MBP loss in the spinal cords compared to the control group (n = 5/group). Scale bar: 100 μm. Unpaired t-test. K-L. ICV injection of bumetanide during days 8-14 post-EAE induction decreases CD4+ T cell infiltration in the ChP during the same time (n = 5/group). Scale bar: 100 μm. Unpaired t-test. Data are presented as mean ± SEM. ns: non-significant, ###P < 0.001, * P < 0.05, ** P < 0.01, *** P < 0.001. i.p.: intraperitoneal, ChP: choroid plexus; dpi: day post immunization. Note: CD4 immunostaining was performed on isolated ChP tissues rather than brain slices

Similar articles

References

    1. Hafler DA. Multiple sclerosis. J Clin Invest. 2004;113(6):788. - PMC - PubMed
    1. Owens B. Multiple sclerosis. Nature. 2016;540(7631):S1. - PubMed
    1. Marcus R, What. Is Multiple Sclerosis? JAMA. 2022;328(20):2078. - PubMed
    1. Freeman L, Longbrake EE, Coyle PK, Hendin B, Vollmer T. High-Efficacy therapies for Treatment-Naive individuals with Relapsing-Remitting multiple sclerosis. CNS Drugs. 2022;36(12):1285. - PMC - PubMed
    1. Bjornevik K, Munz C, Cohen JI, Ascherio A. Epstein-Barr virus as a leading cause of multiple sclerosis: mechanisms and implications. Nat Rev Neurol. 2023;19(3):160. - PubMed

MeSH terms

Substances

LinkOut - more resources