. 2025 Mar 13;24(1):76.
doi: 10.1186/s12943-025-02288-9.

ADT-1004: a first-in-class, oral pan-RAS inhibitor with robust antitumor activity in preclinical models of pancreatic ductal adenocarcinoma

Affiliations

ADT-1004: a first-in-class, oral pan-RAS inhibitor with robust antitumor activity in preclinical models of pancreatic ductal adenocarcinoma

Dhana Sekhar Reddy Bandi et al. Mol Cancer. .

Abstract

Background: Oncogenic KRAS mutations occur in nearly, 90% of patients with pancreatic ductal adenocarcinoma (PDAC). Targeting KRAS has been complicated by mutational heterogeneity and rapid resistance. We developed a novel pan-RAS inhibitor, ADT-1004 (an oral prodrug of ADT-007) and evaluated antitumor activity in murine and human PDAC models.

Methodology: Murine PDAC cells with KRASG12D mutation (KPC-luc or 2838c3-luc) were orthotopically implanted into the pancreas of C57BL/6J mice, and four PDX PDAC tumors with KRAS mutations were implanted subcutaneously in NSG mice. To assess potential to overcome RAS inhibitor resistance, parental and resistant MIA PaCa-2 PDAC cells (KRASG12C mutation) were implanted subcutaneously. Subcutaneously implanted RASWT BxPC-3 cells were used to assess the selectivity of ADT-1004.

Results: ADT-1004 potently blocked tumor growth and RAS activation in mouse PDAC models without discernable toxicity with target engagement and reduced activated RAS and ERK phosphorylation. In addition, ADT-1004 suppressed tumor growth in PDX PDAC models with KRASG12D, KRASG12V, KRASG12C, or KRASG13Q mutations and increased CD4+ and CD8+ T cells in the TME consistent with exhaustion and increased MHCII+ M1 macrophage and dendritic cells. ADT-1004 demonstrated superior efficacy over sotorasib and adagrasib in tumor models resistant to these KRASG12C inhibitors and MRTX1133 resistant KRASG12D mutant cells. As evidence of selectivity for tumors with mutant KRAS, ADT-1004 did not impact the growth of tumors from RASWT PDAC cells.

Conclusion/significance: ADT-1004 has strong antitumor activity in aggressive and clinically relevant PDAC models with unique selectivity to block RAS-mediated signaling in RAS mutant cells. As a pan-RAS inhibitor, ADT-1004 has broad activity and potential efficacy advantages over allele-specific KRAS inhibitors. These findings support clinical trials of ADT-1004 for KRAS mutant PDAC.

Keywords: KRAS; Pancreatic ductal adenocarcinoma; RAS-driven malignancies; Tumor immune microenvironment; pan-RAS inhibitor.


Conflict of interest statement

Declarations. Ethics approval: Not applicable. Consent to participate: Not applicable. Consent to publish: Not applicable. Competing interests: The authors declare no competing interests.

Figures
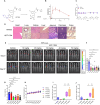
Fig. 1
Fig. 1
Evaluation of ADT-1004 efficacy and toxicity profile in murine model of pancreatic cancer. (A). Chemical structures of ADT-1004 and ADT-007. (B). Plasma levels of ADT-007 in mice following a single oral administration of ADT-1004 (100 mg/kg, mean ± SD, n = 3–4). Dash line shows ADT-007 IC50 (3 nM) for MIA PaCa-2 PDAC cells in vitro. (C). Body weights of C57BL/6J mice treated with ADT-1004 (175 mg/kg, n = 5) or vehicle (n = 10) orally BID, 5x/week for 3.5 weeks. (D). Histopathological examination of vital organs (heart, lung, kidney, liver, jejunum, pancreas, and colon) from mice treated with ADT-1004 at 175 mg/kg BID as assessed by H&E staining. (E). F-Luc-labeled KPC cells were orthotopically implanted into C57BL/6J mice (n = 30). After 1 week, groups of 5 mice were orally administered vehicle or ADT-1004 (10, 20, 30, 40, and 50 mg/kg). Bioluminescence images at the indicated time points are shown. (F). Relative normalized whole-body bioluminescence intensities in mice under the indicated conditions (n = 5) (G). Tumors weights at the indicated conditions for experiment in (E). Note that one of the animals in 40 mg/kg group died on day 27 of the study prior to necropsy and thus excluded from the analysis. (H). Average body weights of the animals during the treatment shown in experiment (E). (I). The concentration of ADT-007 in plasma of mice on the last day of treatment (IC50 < 6 nM for KPC cells). (J). The concentration of ADT-1004 in plasma of mice on the last day of treatment. All quantitative data represent the mean ± SEM. ANOVA was used as statistical test. ns, non-significant, ∗p < 0.05, ∗∗p < 0.01, ∗∗∗p < 0.001, and ∗∗∗∗p < 0.0001
Fig. 2
Fig. 2
Effect of ADT-1004 treatment on tumor growth and molecular markers in KPC cell-implanted C57BL/6J mice. (A). KPC-luc cells were injected orthotopically into the pancreas of C57BL/6J mice. Representative bioluminescence images at the indicated time points are shown. (B). Relative normalized whole-body bioluminescence intensities in mice under the indicated conditions (n = 5). (C). Average body weights of mice treated with vehicle and ADT-1004 (40 mg/kg). (D). Tumor weights were measured from mice at the end of the experiment under the indicated conditions for experiment in (A). (E). Tumor images at the end of the experiment are shown. (F) The percentages of CD45+ CD11b+ F4/80, and CD206+ (macrophages), CD11b+ F4/80+ PD-L1+, and M1/M2 ratios increased in tumors from ADT-1004 treated (n = 4) compared to vehicle (n = 5) treated mice. (G). The tumors were probed for detecting activated RAS GTP levels by GST-Raf1-RBD pull-down assay (left) and graph depicting quantification of activated RAS GTP levels (right). (H). Indicated tumor tissues were analyzed for pERK and total ERK by immunoblotting. β-Actin was used as a loading control (left). Graph depicting quantification of pERK normalized using β-Actin (right). All quantitative data represent the mean ± SEM. t-test was used for statistical analysis. ns, non-significant, ∗p < 0.05, ∗∗p < 0.01, ∗∗∗p < 0.001, and ∗∗∗∗p < 0.0001
Fig. 3
Fig. 3
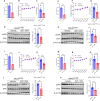
ADT-1004 treatment suppresses tumor growth and modulates tumor microenvironment in C57BL/6J mice with 2838c3 cell implants. (A). F-Luc-labeled 2838c3 cells were orthotopically implanted into C57BL/6J mice (n = 20). Four groups of 5 mice were treated with vehicle or ADT-1004 by oral gavage (20 mg/kg, 20 mg/kg BID, and 40 mg/kg body weight) 5 days/week per week. (B). Normalized bioluminescence intensities of the tumors in the 4 groups of mice. (C). Average body weights of the animals during the treatment shown in experiment (A). (D). Tumor weights were measured from mice at the end of the experiment for indicated dosing schedules (A). (E). Tumor images at the end of the experiment are shown for vehicle and ADT-1004 (20 mg/kg BID and 40 mg/kg). (F). Indicated tumor tissues were probed for detecting activated RAS GTP levels by GST-Raf1-RBD pull-down assay (left). Graph depicting the quantification of activated RAS GTP levels (right). (G). Indicated tumor tissues were analyzed for pERK and total ERK. β-Actin was used as a loading control (left). Graph depicting the quantification of pERK normalized using β-Actin (right). (H). Proportions of CD4+ T-cells, CD4+ Foxp3+, CD4+ PD-1+ T cells, and CD4+ CTLA-4+ T cells in 2838c3 TiME in ADT-1004 (n = 5) and vehicle (n = 5) treated mice. (I). Expression of CD8+ T-cells, CD8+ PD-1+ T cells, CD8+ PD-1+ LAG3+, and CD8+ PD-1+ CTLA-4+ subsets from 2838c3 TME. (J). The percentages of CD11b+ MHCIIhi, XCR1+ cDC1, and CD11b+ CD11chi MHCII hi CD172α+ cDC2 subsets increased in ADT-1004 (n = 5) compared to vehicle (n = 5) treated mice. (K). The percentages of CD45+ CD11b+ F4/80, and CD206+, CD11b+ F4/80+ PD-L1+, M1/M2 ratio increased in ADT-1004 treated (n = 5) compared to vehicle (n = 5) treated mice. ANOVA and Welch’s t-test was used for statistical analysis where appropriate. Error bars indicate SD. ns, non-significant, ∗p < 0.05, ∗∗p < 0.01, ∗∗∗p < 0.001, and ∗∗∗∗p < 0.0001
Fig. 4
Fig. 4
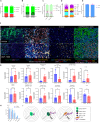
Spatial quantification reveals increased immune infiltration in ADT-1004 treated TME. (A). The expression matrix for each of the cell phenotypes based on Visiopharm results. (B). Percentage of neoplastic cells (y-axis) in each tumor (color legend) for each core of the TMA (x-axis). (C). Mesenchymal expressing CKdim cells in ADT-1004 treated tumors did not co-localize with CD8 + or CD4 + T cells. (D). Percentage of immune cells (y-axis) in each tumor (color legend) for each core of the TMA (x-axis). (E). Annotations of classified neoplastic and immune cells (top) in the vehicle (left) and ADT-1004 treatments (right) and the corresponding antigens detected in the multi-color fluorescence images (bottom). (F). The t-distributed stochastic neighbor embedding (tSNE) plot showed 13 clusters (color legend) in a single core (left). Expression programs of different cell phenotypes (right) in the vehicle and ADT-1004 treated cores. tSNEs of single-nucleus profiles (dots) of neoplastic cells (cancer-epi, cancer-dim, and CAFs) from all tumors, and immune compartments (Macrophages, cyto T cells, T cells, Teff, and Tregs). (G). Unchanged CKbright and CKdim cells and increasing trend in endothelial cell infiltration in ADT-1004 treated TMAs compared to vehicle. Unchanged Tregs, significantly increased Teff, increased Teff/Treg ratio, and increased B cells in ADT-1004 treated TMAs compared to vehicle. Increased monocytic MDSCs (CD11b+ Ly6G) and decreased granulocytic MDSCs (CD11b+ Ly6G+) in ADT-1004 treated TMAs compared to vehicle. Slightly reduced CAFs and increased endothelial cells in ADT-1004 treated TMAs compared to vehicle. (H). Unchanged percentage of CAFS in (α-SMA, PDGFRβ, FAP, Desmin, and Integrinβ3). (I). Reduced pericytic coverage in ADT-1004 treated tumors compared to vehicle in endothelial cells (left). Mesenchymal expressing CKdim cells in ADT-1004 treated tumors did not co-localize with CD8+ or CD4+ T cells (middle). FAP+ and Integrinβ3+ CAFs exclude CD8+ T cells Integrinβ3+ CAFs exclude CD4+ T cells (right). Welch’s t-test was used for statistical analysis. ns: not significant and *p < 0.05
Fig. 5
Fig. 5
ADT-1004 treatment suppresses tumor growth and downregulates pERK levels in KRAS-mutant PDX models. (A). Tumor growth curves of KRASG12D PDX implanted subcutaneously into NSG mice and treated with vehicle or ADT-1004 (n = 6). (B). Average body weights of mice treated with vehicle and ADT-1004 (40 mg/kg). (C). Tumor weights at the end of the experiment under the indicated conditions. (D). The indicated tumor tissues were probed for measuring pERK and total ERK. β-Actin was used as a loading control. Graph depicting the quantification of pERK by western blot analysis, normalized using β-Actin (left). (E) Tumor growth curves of KRASG12C PDX implanted subcutaneously into NSG mice (n = 6). (F). Average body weights of mice treated with vehicle and ADT-1004 (40 mg/kg). (G). Tumor weights were measured from mice at the end of the experiment. (H). The indicated tumor tissues were probed for measuring pERK and total ERK. β-Actin was used as loading control (right). Graph depicting the quantification of pERK by western blot analysis, normalized using β-Actin (left). (I). Tumor growth curves of KRASG12V PDX implanted subcutaneously into NSG mice (n = 6). (J). Average body weights of the animals during the treatment. (K). Tumor weights from mice at the end of the experiment. (L). The indicated tumor tissues were probed for measuring pERK and total ERK. β-Actin was used as loading control (right). Graph depicting the quantification of pERK by western blot analysis, normalized using β-Actin (left). (M) Tumor growth curves of KRASG13Q PDX implanted subcutaneously into NSG mice (n = 6). (N). The average body weights of the animals during the treatment. (O) Tumor weights at the end of the experiment under the indicated conditions. (P) The indicated tumor tissues were probed for measuring pERK and total ERK. β-Actin was used as loading control (right). Graph depicting the quantification of pERK by western blot analysis, normalized using β-Actin (left). Data represent the mean ± SEM. Welch’s t-test was used for statistical analysis. *p < 0.05, **p < 0.01, ***p < 0.001, and ****p < 0.0001
Fig. 6
Fig. 6
ADT-1004 treatment downregulates molecular markers in KRAS-mutant PDX models. (A). Representative IHC images of pERK, αSMA, and Ki-67 (left) and quantifications of IHC results (right) in KRASG12D PDX model. (B). Representative IHC images of pERK, αSMA, and Ki-67 (left) and quantifications of IHC results (right) in KRASG12C PDX model. (C). Representative IHC images of pERK, αSMA, and Ki-67 (left) and quantifications of IHC results (right) in KRASG12V PDX model. (D). Representative IHC images of pERK, αSMA, and Ki-67 (left) and quantifications of IHC results (right) in KRASG13Q PDX model. Data represent the mean ± SEM. Welch’s t-test was used for statistical analysis. *p < 0.05, **p < 0.01, ***p < 0.001, and ****p < 0.0001
Fig. 7
Fig. 7
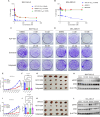
ADT-1004 demonstrates superior efficacy in suppressing the growth of KRASG12Ci−resistant cells compared to Sotorasib and Adagrasib. (A-B). PDAC cell lines were treated with different concentrations of ADT-007, sotorasib, and adagrasib for 3 days and analyzed for survival using the MTT assay. (C-D). Indicated PDAC cell lines were treated with the different concentrations of ADT-007, sotorasib or adagrasib for 2 weeks. Representative cell survival was then measured using clonogenic assays. (E and I). Tumor volumes of mice implanted with MIA PaCa-2 or MIA-AMG-Res cells with the indicated treatments. (F and J) Tumor weights were measured from mice for the indicated conditions for experiments in (E and I). (G and K) Representative tumor images of NSG mice in the vehicle, ADT-1004, Sotorasib, and Adagrasib (40 mg/kg) groups at the end of the experiment. (H and L). The indicated tumor tissues were probed for pERK and total ERK expression by immunoblotting. β-Actin was used as a loading control. Data represent the mean ± SEM. ANOVA and area under curve (AUC) was used for statistical analysis where appropriate. ns: not significant, *p < 0.05, **p < 0.01, ***p < 0.001, and ****p < 0.0001

Update of

References

    1. Yousef A, Yousef M, Chowdhury S, Abdilleh K, Knafl M, Edelkamp P, Alfaro-Munoz K, Chacko R, Peterson J, Smaglo BG. Impact of KRAS mutations and co-mutations on clinical outcomes in pancreatic ductal adenocarcinoma. NPJ Precision Oncol. 2024;8(1):27. - PMC - PubMed
    1. Mizrahi JD, Surana R, Valle JW, Shroff RT. Pancreatic cancer. Lancet. 2020;395(10242):2008–20. - PubMed
    1. Siegel RL, Miller KD, Wagle NS, Jemal A. Cancer statistics, 2023. Cancer J Clin. 2023;73(1):17–48. - PubMed
    1. Jiang Y, Sohal DP. Pancreatic adenocarcinoma management. JCO Oncol Pract. 2023;19(1):19–32. - PubMed
    1. Siegel RL, Giaquinto AN, Jemal A. Cancer statistics, 2024. Cancer J Clin. 2024;74(1). - PubMed

MeSH terms

Substances