. 2025 Mar 13;22(1):78.
doi: 10.1186/s12974-025-03402-w.

T cell receptor activation contributes to brain damage after intracerebral hemorrhage in mice

Affiliations

T cell receptor activation contributes to brain damage after intracerebral hemorrhage in mice

Yuwen Xiu et al. J Neuroinflammation. .

Abstract

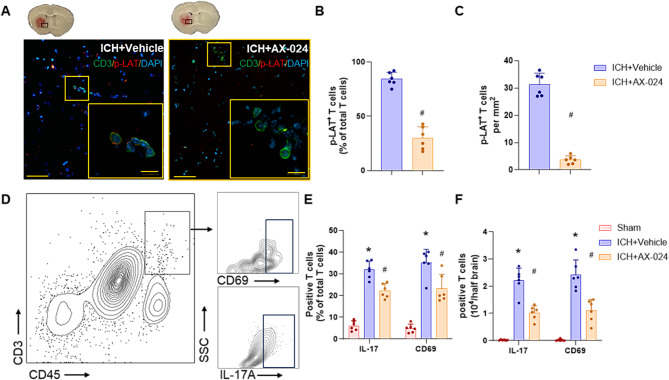
Background: Our previous studies demonstrated that activated T cells accumulate in perihematomal regions following intracerebral hemorrhage (ICH) and exacerbate hemorrhagic brain injury. In the present study, we aimed to explore the mechanisms underlying brain-infiltrating T cell activation and the associated pathophysiological effects in neurological outcomes following ICH.

Methods: We employed standardized collagenase injection-induced and autologous blood injection models of ICH in male C57BL/6J mice. T cell receptor (TCR) activation, immune cell infiltration, and cytokine production were quantified through immunostaining, flow cytometry, and cytokine arrays at 1- and 3-days post-ICH. Brain edema volume was measured at 3 days post-ICH and neurobehavioral assessments were conducted up to 14 days post-ICH. Pharmacological inhibition of TCR activation was achieved using the TCR-specific inhibitor AX-024, administered intraperitoneally at a dosage of 10 mg/kg 1-hour post-ICH.

Results: Flow cytometry and immunostaining detected TCR activation of brain-infiltrating T cells. Specific TCR activation inhibitor AX-024 administration markedly reduced TCR activation and the production of pro-inflammatory cytokines in the brain at 1- and 3-days post-ICH. Moreover, AX-024 administration led to a significant reduction in the infiltration of other leukocyte populations, and significantly reduced brain edema while improved long-term sensorimotor and cognitive outcomes up to 14 days post-ICH.

Discussion: Our findings underscore the critical role of TCR activation in the mobilization and activation of brain-infiltrating T cells post-ICH. Inhibition of TCR activation via AX-024 administration might be developed as a promising therapeutic strategy to improve neurological outcomes following ICH. However, further research is necessary to thoroughly explore the complex pathophysiological processes involved.

Keywords: Inflammation; Intracerebral hemorrhage; Leukocyte; T cell activation; T-cell receptor.


Conflict of interest statement

Declarations. Ethics approval: All animal experiments were performed with ethics approval (protocol ID: 2118) from the Institutional Animal Care and Use Committee (IACUC) of Tulane University. Competing interests: The authors declare no competing interests.

Figures

Fig. 1
Fig. 1
TCR of brain-infiltrating T cells in the peri-hematoma region is activated at acute phase after ICH in mice. (A-C) ICH was induced by injection of collagenase IV in C57BL/6J mice. Brain tissue was harvested at 24 h after ICH. (A) Flow cytometry gating to access the expression of phosphorylated Zap70 (p-Zap70) and CD3 ζ (p-CD3ζ) in brain-infiltrating CD45+ CD3+ T cells after ICH. (B-C) Comparison of cell counts showing the percentage (B) and absolute cell counts (C) of p-Zap70 and p-CD3ζ in brain-infiltrating CD45+ CD3+ T cells in sham and ICH groups. n = 6 mice per group; Mean ± SD, and *P < 0.05 vs. Sham group. (D-F) ICH was induced by injection of autologous blood in C57BL/6J mice. Brain tissue was harvested at 24 h after ICH. (D) Double immunostaining of TCR activation marker phosphorylated LAT (p-LAT) with T cells (CD3+) in the peri-hematoma region of both sham and ICH groups. Scale bar: 10 μm. (E-F) Comparison of percentage (E), and the cell count (F) of p-LAT positive T cells in the peri-hematoma area between sham and ICH groups. n = 6 mice per group; Mean ± SD, and *P < 0.05 vs. Sham group. n = 6 mice per group. Mean ± SD, and *P < 0.05 vs. WT group. Student’s t-test in (B, C, F) and Mann–Whitney U test in (E)
Fig. 2
Fig. 2
Inhibition of TCR activation by AX-024 prevents brain-infiltrating T cell activation at acute phase after ICH in mice. ICH model was induced by collagenase IV injection in C57BL/6J mice. Brain tissue was obtained at 1 or 3 days after ICH. (A) Double immunostaining of TCR activation marker p-LAT with T cells (CD3+) in the peri-hematoma region of ICH and ICH + AX-024 groups at 24 h post-ICH. Scale bar: 50 μm and (inset) 10 μm. (B-C) Comparison of the total T cell number, the percentage (B) and the cell count (C) of brain-infiltrating CD3+ T cells expressing p-LAT in the peri-hematoma region at 24 h post-ICH. (D) Flow cytometry plots showing activated T cells (either IL-17 A or CD69 positive) in total brain-infiltrating T cells 3 days after ICH in sham, ICH and ICH + AX-024 groups. (E-F) Percentage (E) and the cell counts (F) of activated T cells (either IL-17 or CD69 positive) in total brain-infiltrating T cells at day 3 after ICH. n = 6 mice per group. Mean ± SD, *P < 0.05 vs. Sham group, and #P < 0.05 vs. ICH + Vehicle group. Student’s t-test in (B, C) and two-way ANOVA in (E, F)
Fig. 3
Fig. 3
Inhibition of TCR activation by AX-024 prevents inflammatory response of brain-infiltrating T cell after ICH in mice. ICH model was induced by collagenase IV injection in C57BL/6J mice. Brain tissue and peripheral blood were obtained at 3 days after ICH. (A-B) Flow cytometry analysis of T cells in brain (A) and peripheral blood (B) after ICH. The cell counts of CD3+, CD4+, and CD8+ T cells in brain and blood was analyzed. (C) Flow cytometry analysis of cytokine IFN-γ, IL-1β, and IL-10 in brain-infiltrating CD4+ T cell after ICH. (D) Flow cytometry analysis of perforin and granzyme B (GzmB) in brain-infiltrating CD8+ T cell 3 days post-ICH. n = 6–8 mice per group. Mean ± SD, *P < 0.05 vs. Sham group, and #P < 0.05 vs. ICH + Vehicle group. Two-way ANOVA in (A, B) and Mann-Whitney U test in (C, D)
Fig. 4
Fig. 4
Inhibition of TCR activation by AX-024 alleviates cerebral pro-inflammatory response after ICH in mice. ICH model was induced by collagenase IV injection in C57BL/6J mice. (A) Representative gating strategy for microglia and brain-infiltrating leukocytes. (B-C) Flow cytometry quantification showing cell counts of microglia (B), macrophages, neutrophils, B cells and NK cells (C) in sham, ICH, and ICH + AX-024 mice at 3 day after ICH. (D-E) Representative image (D) and quantification (E) of double staining of caspase-1 and Iba1 in peri-hematoma region at day 3 post ICH. Scale bar: 20 μm. White arrows: Caspase-1⁺ microglia (Iba1⁺). n = 6–8 mice per group. Mean ± SD, *P < 0.05 vs. Sham group, and #P < 0.05 vs. ICH + Vehicle group. (F) Cytokine array image and of ipsilateral brain tissue with or without AX-024 treatment. Quantification of cytokine fold change between ICH and ICH + AX-024 group, n = 2 independent experiments.; blue or red, cytokines fold change down- or up- regulated in AX-024 treated group, respectively. Mean. One-way ANOVA in (B), two-way ANOVA in (C), and student’s T test in (E)
Fig. 5
Fig. 5
Validation of AX-024’s specificity in inhibition of TCR activation in vitro. (A) Monocytes were harvested from spleen and cultured with HMGB1 or control saline, followed by treatment with AX-024 or vehicle. (B-C) RT-qPCR analysis of mRNA levels showing expression of TNF-α (B) and IL-1β (C) in groups of monocytes receiving indicated treatment at 24 h. A total of 4 independent experiments were repeated, n = 3 mice per group/experiment. Mean ± SD. *P < 0.05 vs. Saline + Vehicle, and #P < 0.05 vs. HMGB1 + Vehicle. (D) Naïve T cells were negatively isolated from spleen and cultured with CD3/CD28-loaded MACSibeads or PMA + ionomycin, followed by treatment with AX-024 or vehicle. (E-F) Flow cytometry analysis of cytokine levels in cultured T cells showing expression of CD69 (E) and IL-17 (F) in groups of T cells receiving the indicated treatment at 24 h. A total of 4 independent experiments were repeated, n = 3 mice per group/experiment. Mean ± SD, *P < 0.05 vs. MACSibeads + Vehicle group. One-way ANOVA in (B, C, D, E)
Fig. 6
Fig. 6
Inhibition of TCR activation by AX-024 mitigates acute brain edema and improves neurological outcomes after ICH in mice. ICH model was induced by collagenase IV injection in C57BL/6J mice. (A) Schematic diagram showing the timeline of the experimental procedures for the pathological evaluation and neurobehavioral assessments. (B) Brain water content of ipsilateral hemisphere at 3 days after ICH. n = 8 mice per group, (C-E) Representative double-immunostaining images (C) of MBP (green) plus SMI32 (red) show the demyelinating lesion (dashed red circle) and quantification of demyelinating lesion volume (D) and SMI32/MBP ratio (E) in peri-lesion area at 15 days after ICH. Scale bar: 1 mm and (inset = 100 μm). n = 6 mice per group. (F-J). mNSS (F), adhesive removal test (G), foot fault test (H), and MWM (I-J) were performed to assess neurobehavioral outcomes up to 14 days after ICH. n = 6–12 mice per group. Mean ± SD.*P < 0.05 vs. Sham group, and #P < 0.05 vs. ICH + Vehicle group. Mann–Whitney U test in (B), student’s T test in (D, E), two-way ANOVA in (F, G, H, I), and one-way ANOVA in (J)

References

    1. Sun Q, et al. Neurovascular units and Neural-Glia networks in intracerebral hemorrhage: from mechanisms to translation. Transl Stroke Res. 2021;12(3):447–60. - PubMed
    1. Hemphill JC 3, et al. Guidelines for the management of spontaneous intracerebral hemorrhage: A guideline for healthcare professionals from the American heart association/american stroke association. Stroke. 2015;46(7):2032–60. - PubMed
    1. Alsbrook DL, et al. Neuroinflammation in acute ischemic and hemorrhagic stroke. Curr Neurol Neurosci Rep. 2023;23(8):407–31. - PMC - PubMed
    1. Mracsko E, et al. Leukocyte invasion of the brain after experimental intracerebral hemorrhage in mice. Stroke. 2014;45(7):2107–14. - PubMed
    1. Zhang P, et al. Single-cell RNA sequencing reveals the evolution of the immune landscape during perihematomal edema progression after intracerebral hemorrhage. J Neuroinflammation. 2024;21(1):140. - PMC - PubMed

Substances

Grants and funding

LinkOut - more resources