Pharmacokinetics of betamethasone in pre-eclampsia: An in vivo and ex vivo study
- PMID: 40083164
- PMCID: PMC12304831
- DOI: 10.1002/bcp.70035
Pharmacokinetics of betamethasone in pre-eclampsia: An in vivo and ex vivo study
Abstract
Aims: To enhance understanding of betamethasone and its metabolites' pharmacokinetics in pregnancy, specifically early-onset pre-eclampsia, through a population pharmacokinetic model. Additionally, to investigate the placental metabolism and transfer of betamethasone and its main metabolites.
Methods: A prospective, single-centre pharmacokinetic study was conducted in pregnant women (n = 28) with imminent preterm birth treated with intramuscular betamethasone. Betamethasone serum concentrations were determined from serial venous blood samples (n = 194). Placental transfer and metabolism were studied using ex vivo human placental perfusion (healthy term; n = 3) and placental explant experiments (healthy term, n = 4; early-onset pre-eclampsia, n = 4). Additionally, placental mRNA expression of CYP3A4, CYP3A7, 11β-hydroxysteroid dehydrogenase (HSD) 1 and 11β-HSD2 were quantified in healthy and early-onset pre-eclampsia placentas.
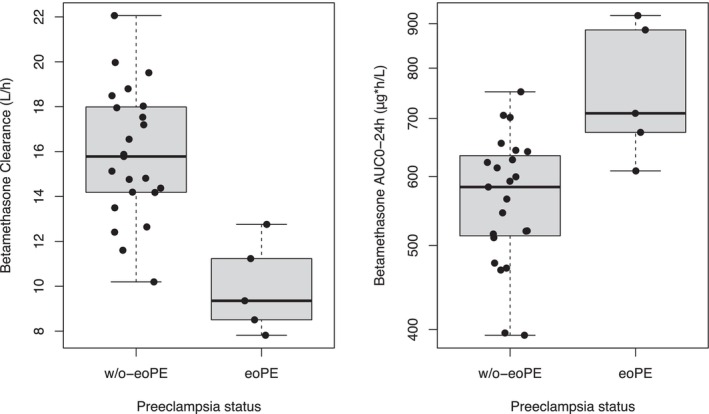
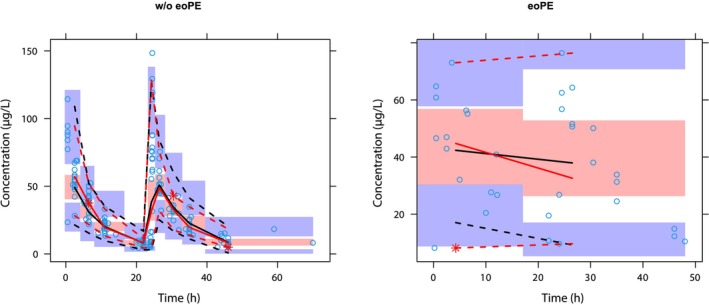
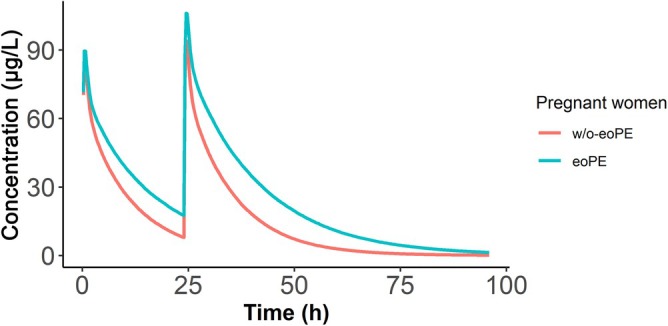
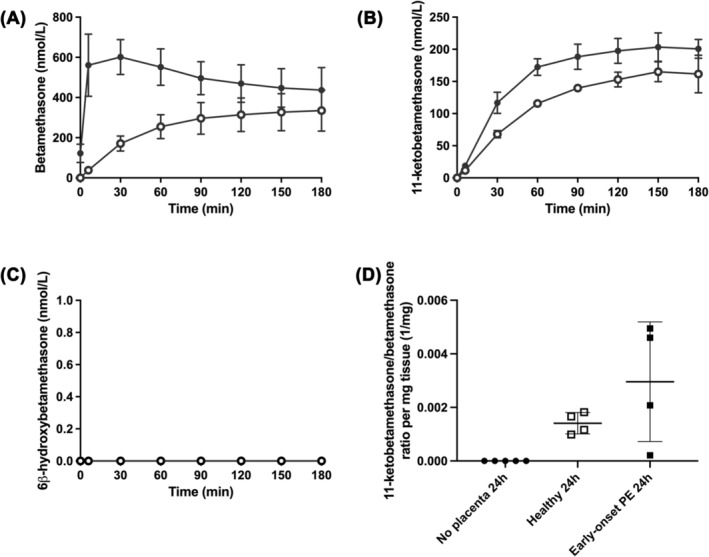
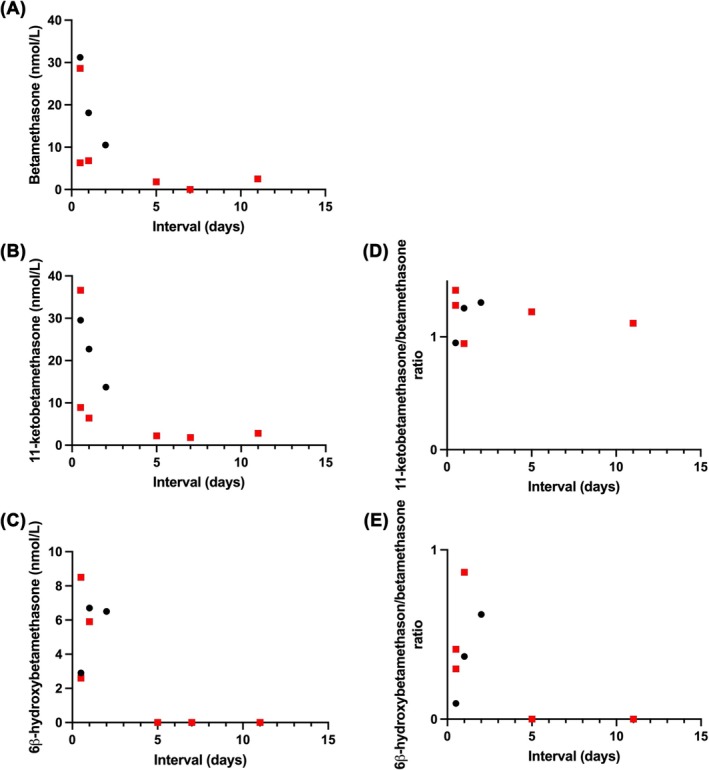
Results: The population pharmacokinetic model was best described by a 2-compartment nonlinear mixed effects model. Betamethasone clearance in early-onset pre-eclamptic women was 60% lower of that observed in women without pre-eclampsia (9.35 vs. 15.78 L/h), resulting in a 40% median increase in maternal betamethasone exposure (1567 vs. 1114 ng h/mL). Ex vivo experiments showed placental transfer of betamethasone to the foetal circulation (foetal-to-maternal ratio 0.76 ± 0.05 [in a perfused placental cotyledon]). The placenta only converted betamethasone into 11-ketobetamethasone, with similar ratios in early-onset pre-eclampsia and healthy placental explants (3.0 ± 2.2 vs. 1.4 ± 0.4 per mg tissue, P = .27). The expression of 11β-HSD1 mRNA was lower in early-onset pre-eclampsia placentas (P = .015), while placental CYP3A7 and 11β-HSD2 mRNA expression were similar.
Conclusion: Women with early-onset pre-eclampsia have elevated betamethasone exposure. Betamethasone transfers freely into the foetal circulation, with placental metabolism resulting only in 11-ketobetamethasone. Decreased placental 11β-HSD1 expression may play a role in increased betamethasone exposure in early-onset pre-eclampsia.
Keywords: antenatal corticosteroids; betamethasone; population pharmacokinetics; preterm birth; pre‐eclampsia.
© 2025 The Author(s). British Journal of Clinical Pharmacology published by John Wiley & Sons Ltd on behalf of British Pharmacological Society.
Conflict of interest statement
The authors declare no conflict of interest. The funders had no role in the design of the study; in the collection, analyses or interpretation of data; in the writing of the manuscript; or in the decision to publish the results.
Figures
Similar articles
-
Different corticosteroids and regimens for accelerating fetal lung maturation for babies at risk of preterm birth.Cochrane Database Syst Rev. 2022 Aug 9;8(8):CD006764. doi: 10.1002/14651858.CD006764.pub4. Cochrane Database Syst Rev. 2022. PMID: 35943347 Free PMC article.
-
Epidural therapy for the treatment of severe pre-eclampsia in non labouring women.Cochrane Database Syst Rev. 2017 Nov 28;11(11):CD009540. doi: 10.1002/14651858.CD009540.pub2. Cochrane Database Syst Rev. 2017. PMID: 29181841 Free PMC article.
-
Use of biochemical tests of placental function for improving pregnancy outcome.Cochrane Database Syst Rev. 2015 Nov 25;2015(11):CD011202. doi: 10.1002/14651858.CD011202.pub2. Cochrane Database Syst Rev. 2015. PMID: 26602956 Free PMC article.
-
Inhibition of placental 11β-HSD2 expression through cAMP/PKA signaling pathway induces intrauterine growth retardation.Toxicol Lett. 2025 Jul;410:83-95. doi: 10.1016/j.toxlet.2025.06.007. Epub 2025 Jun 3. Toxicol Lett. 2025. PMID: 40472942
-
Calcium supplementation commencing before or early in pregnancy, or food fortification with calcium, for preventing hypertensive disorders of pregnancy.Cochrane Database Syst Rev. 2017 Sep 26;9(9):CD011192. doi: 10.1002/14651858.CD011192.pub2. Cochrane Database Syst Rev. 2017. Update in: Cochrane Database Syst Rev. 2019 Sep 16;9:CD011192. doi: 10.1002/14651858.CD011192.pub3. PMID: 28949421 Free PMC article. Updated.
References
-
- Gilstrap LC, Christensen R, Clewell WH, et al. Effect of corticosteroids for fetal maturation on perinatal outcomes. NIH consensus development panel on the effect of corticosteroids for fetal maturation on perinatal outcomes. JAMA. 1995;273:413‐418. doi: 10.1001/jama.1995.03520290065031 - DOI - PubMed
MeSH terms
Substances
Grants and funding
LinkOut - more resources
Full Text Sources
Medical