. 2025 Feb 20:13:1526855.
doi: 10.3389/fcell.2025.1526855. eCollection 2025.

Gut microbiota regulates optic nerve fiber myelination

Affiliations

Gut microbiota regulates optic nerve fiber myelination

Giulia Ronchi et al. Front Cell Dev Biol. .

Abstract

Introduction: Recent evidence supports the hypothesis of an association between gut microbiota and the pathogenesis of retinal and eye diseases, suggesting the existence of a gut-eye axis. However, no data are available on the possible effect of the gut microbiota on the optic nerve fiber maturation and myelin development.

Methods: We investigated the impact of gut microbiota on the optic nerves collected from neonatal and young adult germ-free (GF), gnotobiotic (stably colonized with 12 bacteria strains, OMM12) and control (colonized with a complex gut microbiota, CGM) mice, by performing stereological and morphoquantitative analyses with transmission electron microscopy and gene expression analysis by quantitative real-time PCR.

Results: Young adult GF and OMM12 optic nerve axons are smaller and hypermyelinated compared to CGM ones, while no such differences were detected in neonatal optic nerves. The transcription factors Olig1, Olig2, and Sox10 (oligodendrocyte myelination positive regulators) are downregulated in CGM and OMM12 young adult mice compared to the respective neonates. Such developmental downregulation was not observed in GF optic nerves, suggesting that the absence of the gut microbiota prolongs the stimulation of optic nerve fiber myelination, possibly through mechanisms that are yet to be identified.

Discussion: Altogether, these data underscore the gut microbiota pivotal role in driving optic nerve myelination, contributing to our knowledge about both the gut-eye axis and the gut-brain axis, and opening new horizons for further investigations that will explore the role of the microbiota also in pathologies, injuries and regeneration associated with the optic nerve.

Keywords: germ-free mice; gnotobiotic mice; microbiota; myelin; oligodendrocytes.


Conflict of interest statement

The authors declare that the research was conducted in the absence of any commercial or financial relationships that could be construed as a potential conflict of interest. The authors declared that they were an editorial board member of Frontiers, at the time of submission. This had no impact on the peer review process and the final decision.

Figures
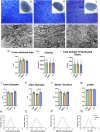
FIGURE 1
FIGURE 1
Neonatal optic nerves showed no morphological differences among groups. (A–C; A′-C′). Toluidine blue-stained cross sections of optic nerves obtained from CGM (A, A′), OMM12 (B, B′) and GF (C, C′) mice, at lower (A′, B′, C′) and higher (A–C) magnification. (D–F) Electron-microscopy images of optic nerves from CGM (D), OMM12 (E), GF (F). A′, B′, C′ Scale Bar = 100µm; (A, B, C) Scale bar = 20 μm; (D, E, F) Scale bar = 2 μm; (G–M) Stereological and morpho-quantitative results: cross-sectional area (G), nerve fiber density (H), total number of myelinated fibers (I), axon diameter (J), fiber diameter (K), myelin thickness (L) and g-ratio (M). Parametric data were subjected to One-Way ANOVA followed by Tukey’s multiple comparisons post hoc test; bar graphs depict the mean ± SEM; *p ≤ 0.05 (n = 5 animals per group). (N–Q) Regression curves (Gaussian equation, not given) of percentile distribution for axon diameter (N), fiber diameter (O), myelin thickness (P) and g-ratio (Q). For each experimental group, the total number of analysed optic nerve fibers were: CGM n = 536; OMM12 n = 579; GF n = 631.
FIGURE 2
FIGURE 2
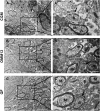
The myelination process is similar among groups. Representative electron microscopy photographs showing the myelination process in the neonatal optic nerves from CGM (A, A′), OMM12 (B, B′) and GF (C, C′). At this stage of development (up to 14 days after birth), optic nerves are composed of myelinated fibers (M), unmyelinated axons (white asterisks), and axons enwrapped by a few layers of myelin membrane (black arrows). Scale bar (A, B, C) = 2 μm; (A′, B′, C′) = 0.5 µm.
FIGURE 3
FIGURE 3
Stereological analysis of young adult optic nerves indicated small differences among groups. (A–C; A′–C′) Toluidine blue-stained cross sections of optic nerves obtained from CGM (A, A′), OMM12 (B, B′) and GF (C, C′) mice, at lower (A′, B′, C′) and higher (A–C) magnification. (D–F) Electron-microscopy images of optic nerves from CGM (D), OMM12 (E), GF (F). (G–I) Stereological results revealed significantly higher total number and density of myelinated fibers in OMM12 mice. (A′, B′, C′) scale bar = 100 μm; (A, B, C) Scale bar = 20 μm; (D, E, F) Scale bar = 2 µm. Parametric data were subjected to One-Way ANOVA followed by Tukey’s multiple comparisons post hoc test; bar graphs depict the mean ± SEM; *p ≤ 0.05 (n = 5 animals per group).
FIGURE 4
FIGURE 4
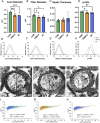
Young adult GF and OMM12 optic nerves displayed smaller and hypermyelinated nerve fibers compared to CGM. (A–D) Morpho-quantitative results of young adult optic nerves (n = 5 animals per group). Parametric data were subjected to One-Way ANOVA followed by Tukey’s multiple comparisons post hoc test; bar graphs depict the mean ± SEM; *p ≤ 0.05, **p ≤ 0.01, ***p ≤ 0.001. (E–H) Regression curves (Gaussian equation, not given) of percentile distribution for axon diameter (E), fiber diameter (F), myelin thickness (G) and g-ratio (H). (I–K) Transmission electron-microscopic comparison of CGM vs. GF (I), CGM vs. OMM12 (J) and OMM12 vs. GF (K) young adult optic nerve myelinated axons. (L–N) Scatter plot graph displaying g-ratio (y-axis) in relation to axon diameter (x-axis) of individual fibers (the total number of analysed optic nerve fibers were: CGM n = 1204; OMM12 n = 1450; GF n = 1266).
FIGURE 5
FIGURE 5
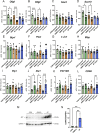
Analysis of gene expression. qRT-PCR analysis for transcripts coding for Olig-1 (A), Olig-2, (B), Pten (C), Myrf (D), Sox-2 (E), Sox-10 (F), c-Jun (G), Mbp (H), Plp1 (I), Iba1 (J), P2Y12R (K) and CD68 (L) in neonatal and young adult mice optic nerves (neonatal CGM and GF, n = 7; neonatal OMM12, n = 8; young adult CGM, OMM12 and GF, n = 9). (M) Western blot analysis of AKT expression levels in protein lysates from young adult optic nerves (n = 3). GAPDH was used as loading control. Protein bands were quantified and AKT expression quantification, normalized to GAPDH, is shown in the graph (N). Normal distribution was tested using the Shapiro-Wilk test. Parametric data were subjected to One-Way ANOVA followed by Tukey’s multiple comparisons post hoc test. Bar graphs depict the mean ± SEM; *p ≤ 0.05, **p ≤ 0.01, ***p ≤ 0.001.

References

    1. Afzaal M., Saeed F., Shah Y. A., Hussain M., Rabail R., Socol C. T., et al. (2022). Human gut microbiota in health and disease: unveiling the relationship. Front. Microbiol. 13, 999001. 10.3389/fmicb.2022.999001 - DOI - PMC - PubMed
    1. Ahlawat S., Asha S. K. K. (2021). Gut-organ axis: a microbial outreach and networking. Lett. Appl. Microbiol. 72 (6), 636–668. 10.1111/lam.13333 - DOI - PubMed
    1. Ahmed H., Leyrolle Q., Koistinen V., Karkkainen O., Laye S., Delzenne N., et al. (2022). Microbiota-derived metabolites as drivers of gut-brain communication. Gut Microbes 14 (1), 2102878. 10.1080/19490976.2022.2102878 - DOI - PMC - PubMed
    1. Almeida R. G., Lyons D. A. (2017). On myelinated axon plasticity and neuronal circuit formation and function. J. Neurosci. 37 (42), 10023–10034. 10.1523/JNEUROSCI.3185-16.2017 - DOI - PMC - PubMed
    1. Atkins E. J., Newman N. J., Biousse V. (2008). Post-traumatic visual loss. Rev. Neurol. Dis. 5 (2), 73–81. - PMC - PubMed

LinkOut - more resources