. 2025 Feb 18;21(5):1932-1948.
doi: 10.7150/ijbs.104598. eCollection 2025.

TMEM105 modulates disulfidptosis and tumor growth in pancreatic cancer via the β-catenin-c-MYC-GLUT1 axis

Affiliations

TMEM105 modulates disulfidptosis and tumor growth in pancreatic cancer via the β-catenin-c-MYC-GLUT1 axis

Yifan Yin et al. Int J Biol Sci. .

Abstract

Background: Pancreatic cancer (PCa) is one of the most malignant diseases in the world. Different from ferroptosis and apoptosis, disulfidptosis is a novel type of cell death. The role of disulfidptosis in PCa remains uncovered. Methods: Disulfidptosis-related lncRNAs were identified based on TCGA-PAAD database. The disulfidptosis-related predict signature was constructed and verified by bioinformatic analysis. TCGA and GTEx database and Renji tissue microarray (TMA) were applied to determine TMEM105 and its clinical significance. F-actin and PI staining were performed to detect disulfidptosis of PCa cells. The biological function of TMEM105 was investigated by loss-of-function and gain-of-function assays. RNA pull-down and LC-MS/MS analysis were employed to detect TMEM105 interacted proteins. The tissue samples from PCa patients with PET-CT information were utilized to validate the TMEM105-β-catenin-c-MYC-GLUT1 pathway in clinical settings. Results: A disulfidptosis-related predict signature, which was comprised of six lncRNAs, was constructed and validated by bioinformatic analysis. TMEM105 was identified as disulfidptosis-related lncRNA whose high expression predicted a poor prognosis in PCa. Functional studies revealed that TMEM105 promoted the growth and mitigated the disulfidptosis in PCa. Mechanically, TMEM105 upregulated the expression of β-catenin by maintaining the protein stability through the proteosome pathway. The forced expressed β-catenin increased the expression of glycolysis-related transcription factor c-MYC, thus induced the transcription activity of GLUT1. Conclusion: These results revealed the growth acceleration and the disulfidptosis mitigation function of TMEM105 in PCa. Targeting the TMEM105-β-catenin-c-MYC-GLUT1 pathway could be a potent therapy for PCa patients.


Conflict of interest statement

Competing Interests: The authors have declared that no competing interest exists.

Figures
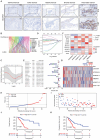
Figure 1
Figure 1
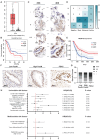
Identifying disulfidptosis-related lncRNAs, construction and validation of the disulfidptosis-related predictive signature in PCa. (A) SLC7A11 expression in five cancer types analyzed by IHC staining. Scale bar: 10x (100 μm) and 20x (50 μm). (B) Sankey diagram of disulfidptosis-related genes and disulfidptosis-related lncRNAs. (C) Cross-validation plot for the penalty term. (D) LASSO expression coefficient plot of disulfidptosis-related lncRNAs. (E) Forest plot of univariate COX regression analysis results for disulfidptosis-related lncRNAs. (F) Heatmap of the correlation between disulfidptosis-related lncRNAs and disulfidptosis-related genes. (G) Risk heatmap of the training set. (H) Distribution plot of risk scores in the training set. (I) Scatter plot of survival status in the training set. (J) Kaplan-Meier (KM) analysis for overall survival (OS) in the training set based on the TCGA database. (K) KM analysis for PFS in the training set based on the TCGA database.
Figure 2
Figure 2
High expression of TMEM105 predicts a poor prognosis in PCa. (A) Expression profile of TMEM105 in TCGA database. (B) KM analysis of OS in patients with high or low TMEM105 expression by GEPIA. (C) Standard ISH grading images of TMEM105 expression in 149 pancreatic cancer tumors. Scale bar: 20x (20 μm) and 40x (10 μm) for negative (-), weak (+), moderate (++), and strong (+++) expressions. (D) Heatmap of correlation between TMEM105 expression and TNM stage based on ISH grading. (E) The KM analysis for the correlation between OS rate and TMEM105 expression based on the Renji cohort. (F) Representative standard ISH staining images of various stages of PCa progression in the Renji cohort, including PanIN (pancreatic intraepithelial neoplasia) and PDAC (pancreatic ductal adenocarcinoma); (scale bar: 50 μm). (G) Statistical analysis for ISH staining in different stages of PDAC, the grades were classified as negative (-), weakly positive (+), moderately positive (++), and strongly positive (+++). (H) Univariate and multivariate Cox regression analyses of clinical and pathological factors in the Renji cohort.
Figure 3
Figure 3
TMEM105 promotes the growth of PCa both in vitro and in vivo. (A) Cell viability of TMEM105 knockdown Mia PaCa-2 and SW-1990 cells. (B) The colony formation assays of TMEM105 knockdown Mia PaCa-2 and SW-1990 cells and its analysis (scale bar: 1 cm). (C) Cell migration assay of TMEM105 knockdown Mia PaCa-2 and SW-1990 cells and its analysis (scale bar: 200 μm). (D) EdU staining of TMEM105 knockdown Mia PaCa-2 and SW-1990 cells and its analysis (scale bar: 150μm). (E) Tumor formation in subcutaneous tumors of the sh-NC and sh-TMEM105 Mia PaCa-2 cells. (F) Tumor growth curves and the weight comparation of the TMEM105 knockdown group and the control group in Mia PaCa-2 cells. (G) Ki67 staining and Tunel assays of the TMEM105 knockdown group and the control group in Mia PaCa-2 cells. (H) The expression of TMEM105 in TMEM105 knockdown group and the control group in Mia PaCa-2 cells. *p < 0.05, **p < 0.01, ***p < 0.001, ****p < 0.0001.
Figure 4
Figure 4
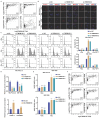
TMEM105 mitigates the PCa disulfidptosis. (A) The correlation between TMEM105 and disulfidptosis-related genes analyzed by GEPIA website based on TCGA and GTEx database. (B) F-actin staining of TMEM105 knockdown Mia PaCa-2 and SW-1990 cells maintained in glucose-free medium for 12 h (scale bar: 50 μm) (C) The TMEM105 knockdown Mia PaCa-2, SW-1990 cells were maintained in glucose-free medium with 0.25 mM DTT for 12 h and subjected to cell death staining. (D) The glucose consumption ability of the cells was evaluated in TMEM105 knockdown Mia PaCa-2, SW-1990 cells or TMEM105-overexpressing PANC-1, Patu8988 cells. (E) The TMEM105-knocking-down Mia PaCa-2 and SW-1990 cells were maintained in glucose-free medium for 12 h and subjected to NADP+/ NADPH detection. (F) The correlation between TMEM105 and PPP key genes analyzed by GEPIA website based on TCGA and GTEx database. *p < 0.05, **p < 0.01, ***p < 0.001, ****p < 0.0001.
Figure 5
Figure 5
GLUT1 is essential for the oncogenic roles of TMEM105 in PCa growth and disulfidptosis. (A) Staining and analyzing the correlation between TMEM105 and GLUT1 in consecutive sections of PCa tumor slide from Renji cohort (scale bar: 200 μm). (B) Correlation of TMEM105 with GLUT1 analyzed by GEPIA website based on TCGA and GTEx database. (C) WB analysis of GLUT1 and c-MYC in TMEM105 knockdown Mia-PaCa 2 and SW-1990 cells (si-1: si-TMEM105-1, si-2: si-TMEM105-2). (D) Fluorescence staining of GLUT1 expression in TMEM105 knockdown cells (scale bar: 200 μm). (E) Colony formation assay and transwell assays of TMEM105-overexpressing PANC-1 and Patu8988 cells treated with DMSO or 5 µM BAY-876 for 6 hours (scale bar: 1 cm, scale bar: 100 μm). (F) F-actin staining of TMEM105-overexpressing PANC-1 and Patu8988 cells treated with DMSO or 5µM BAY-876 for 6 h, followed by glucose-deprivation for 12 h (scale bar: 80 μm). (G) Cell death staining of TMEM105-overexpressing PANC-1 and Patu8988 cells treated with DMSO or 5µM BAY-876 for 6 h, followed by glucose-deprivation for 12 h. (H) Representative images of subcutaneous tumors of the TMEM105-overexpressing group and the control group after receiving BAY-876 treatment (BAY-876 3mg/kg, oral administration once a week for a total of 4 treatments). (I) The weight of subcutaneous tumors mentioned above. *p < 0.05, **p < 0.01, ***p < 0.001, ****p < 0.0001.
Figure 6
Figure 6
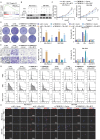
TMEM105 engages the glycolysis-related transcription factor c-Myc to induce GLUT1. (A) GSEA enrichment analysis of TMEM105 based on the TCGA database. (B) WB analysis of c-MYC in TMEM105-knockdown-c-MYC-overexpressing Mia PaCa-2 and SW-1990 cells (si-1: si-TMEM105-1). (C) The cell viability assay of TMEM105-knockdown-c-MYC-overexpressing Mia PaCa-2 and SW-1990 cells. (D) The colony formation assays of TMEM105-knockdown-c-MYC-overexpressing Mia PaCa-2 and SW-1990 cells (scale bar: 1 cm). (E) The transwell assays of TMEM105-knockdown-c-MYC-overexpressing Mia PaCa-2 and SW-1990 cells (scale bar: 100 μm). (F, G) Cell death staining of TMEM105-knockdown-c-Myc-overexpressing Mia PaCa-2 and SW-1990 cells maintained in glucose-free medium for 12h. (H) The F-actin staining of TMEM105-knockdown-c-Myc-overexpressing Mia PaCa-2 and SW-1990 cells maintained in glucose-free medium for 12h (scale bar: 40 μm). *p < 0.05, **p < 0.01, ***p < 0.001, ****p < 0.0001.
Figure 7
Figure 7
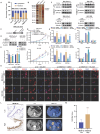
Reduced TMEM105 inhibited tumor progression and enhanced disulfidptosis by β-catenin in pancreatic cancer. (A) qRT-PCR analysis of the subcellular distribution of TMEM105, with U6 as a nuclear marker and ACTB as a cytoplasmic marker. (B) Protein silver staining image after biotin-labeled RNA pulldown experiment. (C) RNA-pulldown assays to validate the interaction between TMEM105 and β-catenin. (D) WB analysis of β-catenin in TMEM105-knocking-down cells. (E) qRT-PCR of β-catenin in TMEM105 knockdown Mia PaCa-2 and SW-1990 cells at the RNA level. (F) WB analysis of TMEM105 knockdown Mia PaCa-2 and SW-1990 cells treated with 20 μg/mL CHX at indicated time or 10 μM MG132 for 6 h. (G) The cell viability assay of TMEM105-knockdown-SKL2001-treated Mia PaCa-2 and SW-1990 cells. (H) The colony formation assays of TMEM105-knockdown-SKL2001-treated Mia PaCa-2 and SW-1990 cells. (I) The transwell assays of TMEM105-knockdown-SKL2001-treated Mia PaCa-2 and SW-1990 cells. (J) Cell death staining of TMEM105-knockdown-SKL2001-treated Mia PaCa-2 and SW-1990 cells maintained in glucose-free medium for 12h. (K) F-actin staining of TMEM105-knockdown-SKL2001-treated Mia PaCa-2 and SW-1990 cells maintained in glucose-free medium for 12h (scale bar: 40 μm). (L) Representative ISH, CT, and PET-CT images of TMEM105 low- and high-expression groups in 14 patients with pancreatic cancer from Renji Hospital, the relationship between TMEM105 expression and SUV-Max was analyzed. (M) Statistical analysis of SUV-max values in 14 patients with pancreatic cancer from Renji Hospital. *p < 0.05, **p < 0.01, ***p < 0.001, ****p < 0.0001.

References

    1. Guo X, Cui Z. Current diagnosis and treatment of pancreatic cancer in China. Pancreas. 2005;31:13–22. - PubMed
    1. Siegel RL, Miller KD, Fuchs HE, Jemal A. Cancer Statistics, 2021. CA Cancer J Clin. 2021;71:7–33. - PubMed
    1. Makohon-Moore A, Iacobuzio-Donahue CA. Pancreatic cancer biology and genetics from an evolutionary perspective. Nat Rev Cancer. 2016;16:553–65. - PMC - PubMed
    1. Traub B, Link KH, Kornmann M. Curing pancreatic cancer. Semin Cancer Biol. 2021;76:232–46. - PubMed
    1. Zhang S, Yao HF, Li H, Su T, Jiang SH, Wang H. et al. Transglutaminases are oncogenic biomarkers in human cancers and therapeutic targeting of TGM2 blocks chemoresistance and macrophage infiltration in pancreatic cancer. Cell Oncol (Dordr) 2023;46:1473–92. - PubMed

MeSH terms