. 2025 Feb 11;28(3):111953.
doi: 10.1016/j.isci.2025.111953. eCollection 2025 Mar 21.

KAT6B overexpression in mice causes aggression, anxiety, and epilepsy

Affiliations

KAT6B overexpression in mice causes aggression, anxiety, and epilepsy

Maria I Bergamasco et al. iScience. .

Abstract

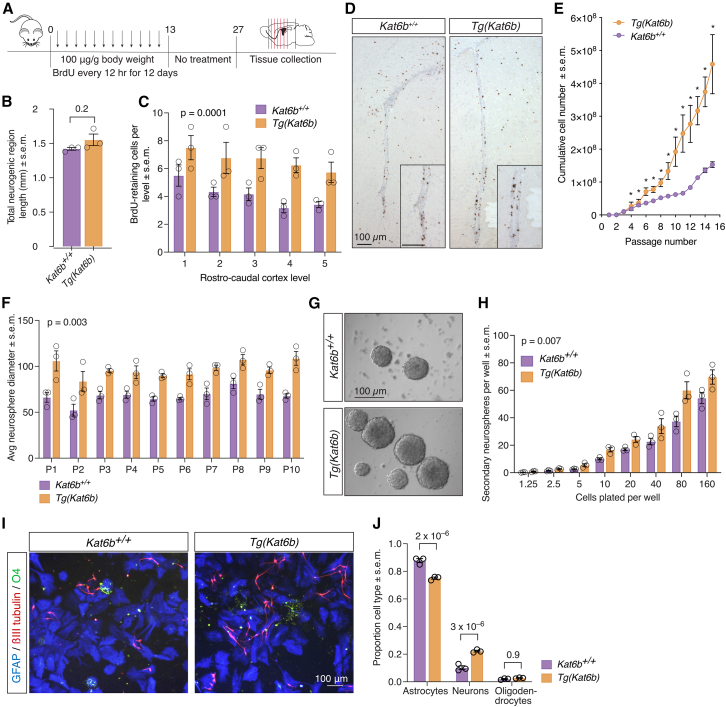
Loss of the gene encoding the histone acetyltransferase KAT6B (MYST4/MORF/QKF) causes developmental brain abnormalities as well as behavioral and cognitive defects in mice. In humans, heterozygous variants in the KAT6B gene cause two cognitive disorders, Say-Barber-Biesecker-Young-Simpson syndrome (SBBYSS; OMIM:603736) and genitopatellar syndrome (GTPTS; OMIM:606170). Although the effects of KAT6B homozygous and heterozygous mutations have been documented in humans and mice, KAT6B gain-of-function effects have not been reported. Here, we show that overexpression of the Kat6b gene in mice caused aggression, anxiety, and spontaneous epilepsy. Kat6b overexpression led to an increase in histone H3 lysine 9 acetylation and upregulation of genes driving nervous system development and neuronal differentiation. Kat6b overexpression additionally promoted neural stem cell proliferation and favored neuronal over astrocyte differentiation in vivo and in vitro. Our results suggest that, in addition to loss-of-function alleles, gain-of-function KAT6B alleles may be detrimental for brain development.

Keywords: Behavioral neuroscience; Biological sciences; Molecular neuroscience; Neuroscience.


Conflict of interest statement

A.K.V. and T.T. are inventors on patent WO2016198507A1. A.K.V. and T.T. have received research funding from the CTx CRC. A.K.V. and T.T. have served on a clinical advisory board for Pfizer.

Figures

None
Graphical abstract
Figure 1
Figure 1
Kat6b overexpression in mice and GTPTS mutations in human cells cause an increase in histone H3 lysine 9 acetylation (A) Log2 fold change in Kat6b mRNA levels in Tg(Kat6b) E12.5 dorsal telencephalon, E15.5 cortex, or E12.5 neural stem and progenitor cells (NSPCs) compared to wild-type control samples assessed by RNA sequencing. The statistical analysis is described in the STAR Methods section under Analysis of RNA-sequencing data. The cutoff for significant changes is a transcriptome-wide false discovery rate (FDR) < 0.05. The FDRs for each RNA source are shown above each bar. (B–D) Western immunoblot detection and densitometry H3K9ac and pan-H3 as loading control in histones derived from NSPCs (B), E12.5 dorsal telencephalon (C), and E15.5 cortex (D) of Kat6b+/+ and Tg(Kat6b) mice. Densitometry values (divided by 1,000) are indicated below each band. Each circle in the bar graphs represents one lane of the immunoblot. 500 ng histones loaded per lane. (E) KAT6B mRNA levels assessed by RT-qPCR normalized to GAPDH in HEK293T cells modified to carry the GTPTS mutations indicated or parental control cells. (F and G) Western immunoblot (F) detecting H3K9ac, H3K23ac, and pan-H3 as loading control in control HEK293T cells and HEK293T cells modified to carry the p.Val1287Glu∗46 mutation. Densitometry values (divided by 1,000) are indicated below each band. Quantification of immunoblots shown in (G). (H and I) Western immunoblot (H) detecting H3K9ac or H3K23ac and pan-H3 as loading control in control HEK293T cells and HEK293T cells modified to carry the p.Lys1258Glyfs∗13 mutation. Quantification of each immunoblot shown in (I). N = 3 mice per genotype (B–D) and 3 to 5 clonal cell lines per KAT6B gene variant (E–I). Each lane in (B–D, F, and H) represents histones from NSPCs derived from an individual mouse (B–D) or from a different human cell clone (F and H); 250 ng (H3K23ac) or 500 ng (H3K9ac) protein loaded per lane. Each circle represents RNA (E) or histones (B–D, G, and I) derived from an individual mouse (B–D) or human cell clone (G and I). Data are presented as mean ± SEM (B–E, G, and I) and were analyzed using a one-way ANOVA with Dunnett post-hoc correction (E) or Student’s t test (B–D, G, and I).
Figure 2
Figure 2
Kat6b overexpression in mice reduces survival (A) Number of Kat6b+/+ and Tg(Kat6b) offspring of Tg(Kat6b) x Kat6b+/+ matings at 3 weeks of age. The total number of mice observed is shown above the bars. The p value is shown above the graph. (B and C) Bodyweight of male (F) and female (G) Kat6b+/+ and Tg(Kat6b) mice from postnatal day 1–21. (D) Representative images of Kat6b+/+ and Tg(Kat6b) mice at postnatal day (P) 7, 14, and 21; the Tg(Kat6b) mouse is on the right in each picture. (E) Number of ultrasonic vocalizations observed over 3 min following maternal separation in Kat6b+/+ and Tg(Kat6b) mice at P4, 8, and 12. (F) Latency (sec) to the first vocalization following maternal separation in Kat6b+/+ and Tg(Kat6b) mice at P4, 8, and 12. N = 901 and 561 mice (A), 5–6 mice per sex and genotype (B and C), and 8 mice per genotype (E and F). Each circle in (E and F) represents an individual mouse. Data are displayed as mean ± SEM and were analyzed by chi-squared test (A) and two-way ANOVA with Sidak post-hoc correction (B, C, E, and F).
Figure 3
Figure 3
Kat6b overexpression causes anxiety, aggression, and abnormal social behavior (A) Representative 5-min traces of the movement of mice in the large open field test. One example of a Kat6b+/+ mouse and two examples of Tg(Kat6b) mouse movements are shown. (B) Proportion of time spent at the periphery of the open field by Kat6b+/+ and Tg(Kat6b) mice. (C–E) Distance traveled (C), average speed (D), and stop fraction (E) of Kat6b+/+ and Tg(Kat6b) mice in the 20-min open field test. (F and G) Proportion time spent in the enclosed arms of the elevated O maze (F) and plus maze (G) by Kat6b+/+ and Tg(Kat6b) mice. (H) Percentage of Kat6b+/+ and Tg(Kat6b) males and females exhibiting aggressive behavior in the home cage. The number of mice exhibiting aggressive behavior/total number of mice assessed per sex and genotype is shown above each bar. p values for the genotype effect shown above the graph. (I) Schematic of the tube dominance test of social aggression. (J) Percentage of “wins” in the tube dominance test by Tg(Kat6b) vs. Kat6b+/+ mice. (K–N) Three-chamber social tests. Discrimination index for the mouse vs. empty cage (K), novel vs. familiar mouse 1 h short-term social recognition (L) and novel vs. familiar mouse 24 h long-term social recognition (M). Time spent interacting with either empty cage or mouse during each session (N). N = 11–16 mice per genotype. Data are presented as mean ± SEM. Each circle represents an individual mouse. Data were analyzed using an unpaired Student’s t test (B–G), chi-squared test, both sexes combined (H), a one-sample t test compared to a theoretical value of 50 (J) or compared to 0 (K, L, and M), or a two-way ANOVA with Sidak post hoc correction (N).
Figure 4
Figure 4
Kat6b overexpression drives NSPC proliferation in vivo and in vitro and promotes neuronal lineage differentiation in vitro (A) Schematic of the experimental design for assessment of long-term BrdU retaining cells. (B) Total length of neurogenic region between the rostral extremity of the anterior commissure and the rostral extremity of the fimbria hippocampi in Kat6b+/+ and Tg(Kat6b) adult brains. (C) Number of BrdU+ cells at five rostro-caudal levels spanning the subventricular zone (SVZ). (D) Representative BrdU immunohistochemistry images of SVZ of Kat6b+/+ and Tg(Kat6b) mice. BrdU staining appears dark brown. (E) Cumulative growth curves of adult SVZ-derived NSPCs from Kat6b+/+ and Tg(Kat6b) mice cultured as neurospheres. (F) Average diameter of Kat6b+/+ and Tg(Kat6b) neurospheres over passages (P) 1 to 10. (G) Representative images of neurospheres at passage 5. (H) Number of secondary neurospheres derived from Kat6b+/+ and Tg(Kat6b) NSPCs over number of cells plated per 96-well plate. (I) Representative images of differentiated Kat6b+/+ and Tg(Kat6b) NSPCs stained for βIII-tubulin (red, neurons), GFAP (blue, astrocytes), and O4 (green, oligodendrocytes). (J) Proportion of neurons, astrocytes, and oligodendrocytes observed in differentiating Kat6b+/+ and Tg(Kat6b) NSPCs dissociated and cultured for 5 days in the absence of EGF and FGF2. N = 3 mice per genotype. Data are presented as mean ± SEM and were analyzed using a Student’s t test (B) or two-way ANOVA with Sidak post hoc correction (C, E, F, H, and J). Scale bars, 100 μm in (D, G, and I).
Figure 5
Figure 5
Kat6b overexpression drives the expression of genes required for nervous system development and neuronal differentiation (A–G) RNA-sequencing data of Tg(Kat6b) vs. wild-type E12.5 dorsal telencephalon and NSPCs derived from E12.5 dorsal telencephalon. The statistical analysis is described in the STAR Methods section under Analysis of RNA sequencing data. The cutoff for significant changes is a transcriptome-wide false discovery rate (FDR) < 0.05. N = dorsal telencephalon from 4 Tg(Kat6b) and 4 wild-type E12.5 embryos and neural stem cell isolates from 6 Tg(Kat6b) and 2 wild-type E12.5 embryos per genotype. (A and B) Mean-difference (MD) plots showing Tg(Kat6b) vs. Kat6b+/+ E12.5 dorsal telencephalon (A) or NSPC (B) samples. The total numbers of upregulated and downregulated genes at FDR <0.05 are indicated in each comparison. Upregulated genes are represented in red, downregulated in blue, and unchanged genes in black. (C and D) Top 20 Gene Ontology (GO; BP) terms enriched for genes upregulated in Tg(Kat6b) E12.5 dorsal telencephalon (C) or NSPCs (D) vs. control samples. (E) Log2 fold-change of the 30 genes most upregulated in Tg(Kat6b) vs. wild-type NSPCs. The FDR for individual genes is shown inside each bar. (F) Log2 fold-change of genes of the NEUROD gene family. The FDR for individual genes is shown inside each bar. (G) Log2 fold-change of the 30 genes most downregulated in Tg(Kat6b) vs. wild-type NSPCs. The FDR for individual genes is shown inside each bar. (H and I) ATAC sequencing data of Tg(Kat6b) vs. wild-type NSPCs derived from E12.5 dorsal telencephalon. The statistical analysis is described in the STAR Methods section under Analysis of ATAC sequencing data. N = neural stem cell isolates from 4 Tg(Kat6b) and 4 wild-type E12.5 embryos. (H) Coverage plot of ATAC sequencing reads in NSPCs of Tg(Kat6b) and Kat6b+/+ NSPCs from −1 kb to +1 kb relative to the transcription start site (TSS). (I) Proportion ATAC sequencing reads in Tg(Kat6b) and Kat6b+/+ NSPCs mapped to genomic features: promoters, enhancers (H3K4me1), and active enhancers (H3K4me1 and H3K27ac).
Figure 6
Figure 6
Adult Tg(Kat6b) mice have more NEUN+ neurons and fewer S100β+ astrocytes in the cortex (A) Representative immunofluorescence images of coronal frozen sections of the frontal cortex of Kat6b+/+ and Tg(Kat6b) mice stained for the neuron marker NEUN (RBFOX3), counterstained with DAPI. (B) Quantification of the proportion NEUN+ of total DAPI+ cells in the frontal, parietal, and occipital cortices in area overlying a length of 400 μm of the ventricular surface for the full depth of the cortex. (C) Representative immunofluorescence images of coronal frozen sections of the frontal cortex of Kat6b+/+ and Tg(Kat6b) mice stained for the astrocyte marker S100β, counterstained with DAPI. (D) Quantification of number of S100β+ as a proportion of total DAPI+ cells across the frontal, parietal, or occipital cortices in area overlying a length of 400 μm of the ventricular surface for the full depth of the cortex. (E) Representative immunohistochemistry images of coronal paraffin sections stained for the cholinergic neuron marker choline acetyltransferase (CHAT) in Kat6b+/+ and Tg(Kat6b) caudoputamen. (F) Quantification of the number of CHAT+ cells per caudoputamen. (G) Representative immunohistochemistry images of coronal paraffin sections stained for the dopaminergic neuron marker tyrosine hydroxylase (TH) in Kat6b+/+ and Tg(Kat6b) ventral midbrain. (H and I) Quantification of the number of TH+ cells per unit area (H) and staining intensity (I) in the ventral midbrain. (J) Representative images of coronal vibratome sections stained for the inhibitory neuronal markers parvalbumin (PVALB, green), somatostatin (SST, magenta), calbindin (CALB1, yellow), and calretinin (CALB2, cyan) in the parietal cortex of Kat6b+/+ and Tg(Kat6b) adult mice. (K) Enumeration of the density of total inhibitory neurons, normalized to volume, at distances from the pia as specified. N = 3–4 mice per genotype. Data in are presented as mean ± SEM (B, D, F, H, I, and K). Each circle (B, D, F, H, and I) represents an individual mouse. Data were analyzed using a two-way ANOVA with Sidak post-hoc correction (B, D, and K) or an unpaired Student’s t test (F, H, I). Scale bars, 100 μm in (A, C, and J) and 500 μm in (E and G).
Figure 7
Figure 7
Kat6b overexpression causes spontaneous tonic-clonic seizures and epileptiform EEG brain activity before and after kindling and promotes neurite outgrowth (A) Representative traces of Golgi-Cox-stained neurons in vibratome sections of adult cortex of Kat6b+/+ and Tg(Kat6b) mice. (B) Sholl analysis of Golgi-Cox-stained upper layer neurons from Kat6b+/+ and Tg(Kat6b) mice. ∗p < 0.05. (C) Average total neurite length of neurons from Kat6b+/+ and Tg(Kat6b) adult brains following Golgi-Cox staining. (D) Representative images of cultured E16.5 cortical neurons from Kat6b+/+ and Tg(Kat6b) fetuses, stained for βIII tubulin and DAPI. Primary (white), secondary (yellow), and tertiary neurites (green) are traced (right images). (E) Total number of primary to quaternary neurites in Kat6b+/+ and Tg(Kat6b) E16.5 cortical neurons. (F) Percentage of Kat6b+/+ and Tg(Kat6b) mice with observed spontaneous tonic-clonic seizures in the home cage. The number of mice with observed seizures over total number of mice assessed per genotype is shown above each bar. The p value for the genotype effect is shown above the graph. (G–I) Number of days on which spikes (G), spike-wave-discharges (SWDs; H), and periodic epileptiform discharges (PEDs; I) were observed in Kat6b+/+ and Tg(Kat6b) mice during baseline assessment (prior to kindling). (J) Schematic drawing of electric kindling induction of epilepsy. (K and L) After-discharge threshold (K) and number of stimulations to the first-class V seizure (L) in Kat6b+/+ and Tg(Kat6b) mice. (M) Average seizure duration across 30 stimulations (2x stimulations per day over 15 days) in Kat6b+/+ and Tg(Kat6b) mice. (N) Average seizure class (I–V) across 30 stimulations (2x stimulations per day over 15 days) in Kat6b+/+ and Tg(Kat6b) mice. (O–Q) Number of days following kindling on which spikes (O), spike-wave-discharges (SWDs; P) and periodic epileptiform discharges (PEDs; Q) were observed in Kat6b+/+ and Tg(Kat6b) mice. N = 3 mice per genotype (A–E), 199 Kat6b+/+ and 136 Tg(Kat6b) mice (F), and 9 Kat6b+/+ and 8 Tg(Kat6b) mice (G–Q). Each circle in (C, E, G–I, K, L, O–Q) represents an individual mouse. Data are presented as mean ± SEM and were analyzed by two-way ANOVA with Sidak correction (B, E, M, and N), unpaired Student’s t test (C, G–I, K, L, O–Q), or chi-squared test (F). Scale bars, 50 μm in (A) and 100 μm in (D).

References

    1. Altman J. Are new neurons formed in the brains of adult mammals? Science. 1962;135:1127–1128. doi: 10.1126/science.135.3509.1127. - DOI - PubMed
    1. Altman J., Das G.D. Post-natal origin of microneurones in the rat brain. Nature. 1965;207:953–956. doi: 10.1038/207953a0. - DOI - PubMed
    1. Lois C., Alvarez-Buylla A. Proliferating subventricular zone cells in the adult mammalian forebrain can differentiate into neurons and glia. Proc. Natl. Acad. Sci. USA. 1993;90:2074–2077. doi: 10.1073/pnas.90.5.2074. - DOI - PMC - PubMed
    1. Eriksson P.S., Perfilieva E., Björk-Eriksson T., Alborn A.M., Nordborg C., Peterson D.A., Gage F.H. Neurogenesis in the adult human hippocampus. Nat. Med. 1998;4:1313–1317. doi: 10.1038/3305. - DOI - PubMed
    1. Seri B., García-Verdugo J.M., McEwen B.S., Alvarez-Buylla A. Astrocytes give rise to new neurons in the adult mammalian hippocampus. J. Neurosci. 2001;21:7153–7160. doi: 10.1523/jneurosci.21-18-07153.2001. - DOI - PMC - PubMed

LinkOut - more resources