. 2025 Feb 10;15(7):3055-3075.
doi: 10.7150/thno.104858. eCollection 2025.

Targeting platinum-resistant ovarian cancer by disrupting histone and RAD51 lactylation

Affiliations

Targeting platinum-resistant ovarian cancer by disrupting histone and RAD51 lactylation

Chenggong Sun et al. Theranostics. .

Abstract

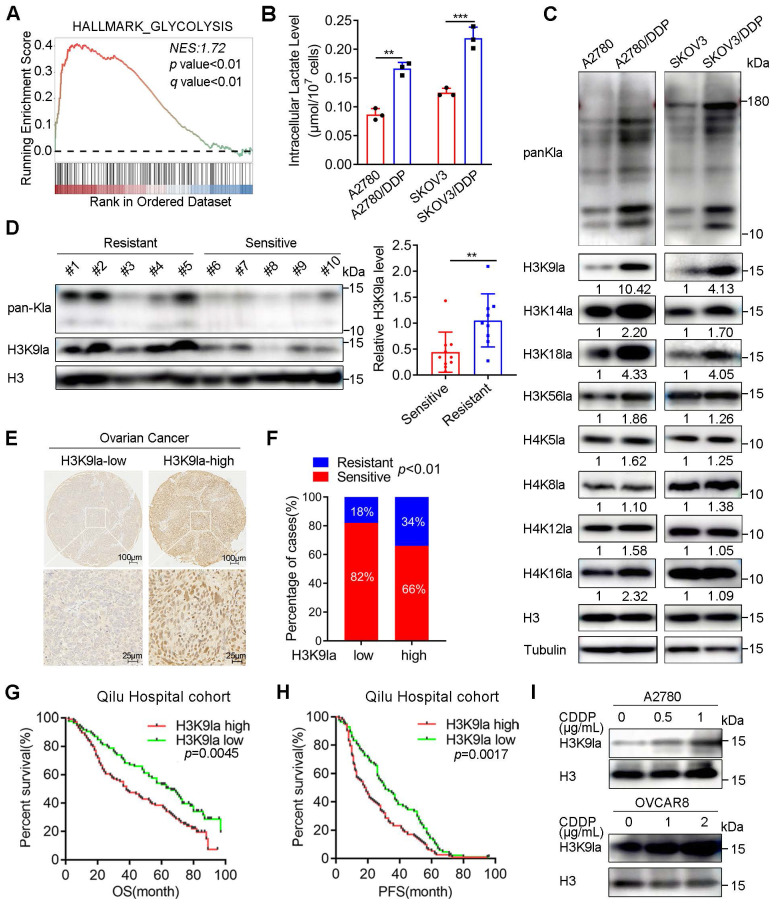
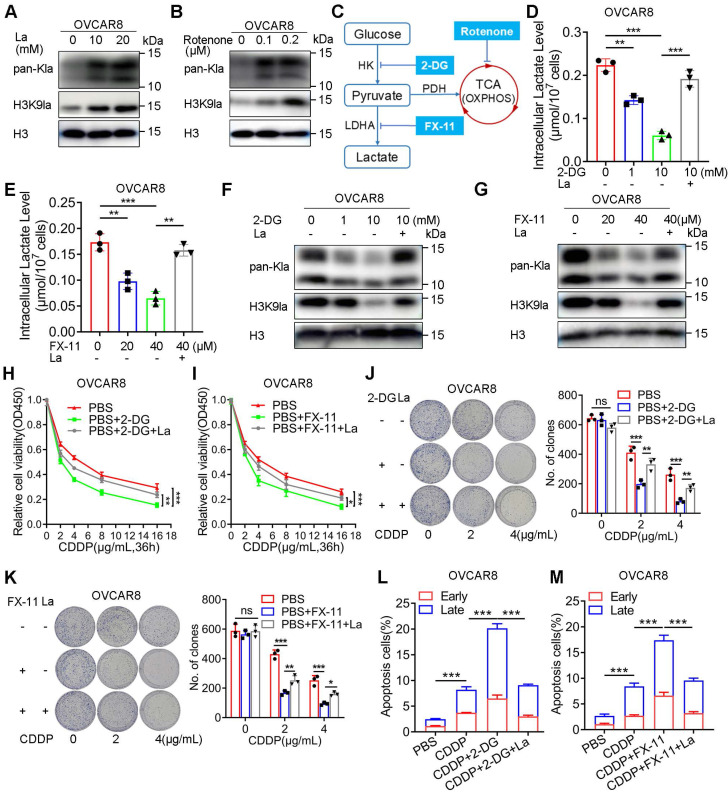
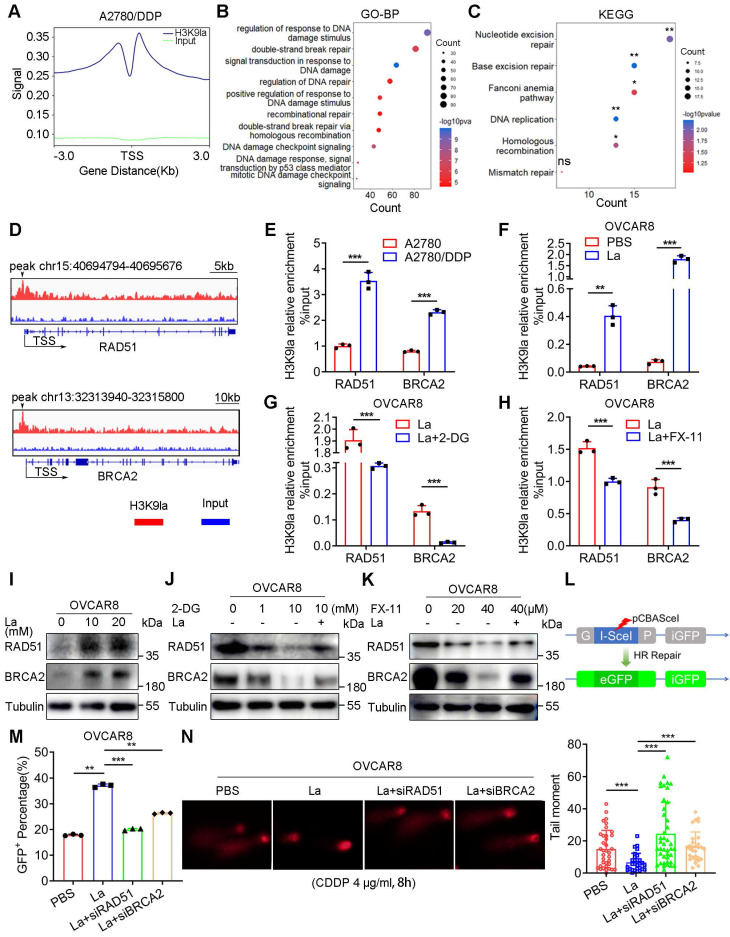
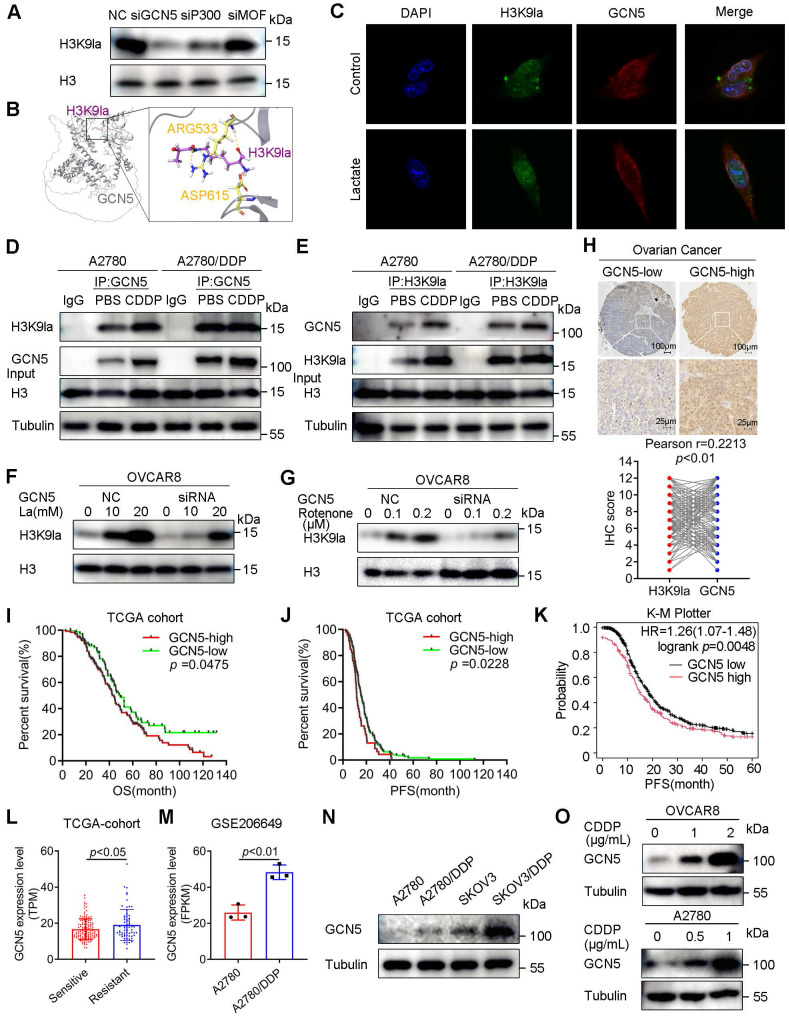
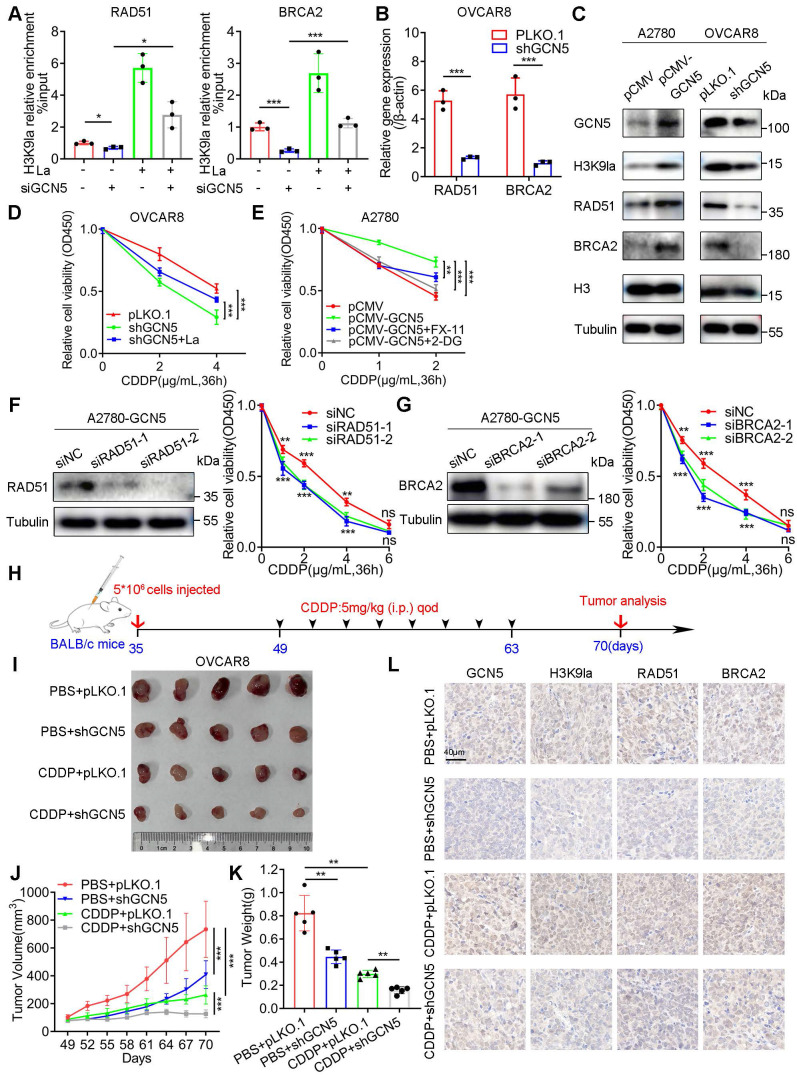
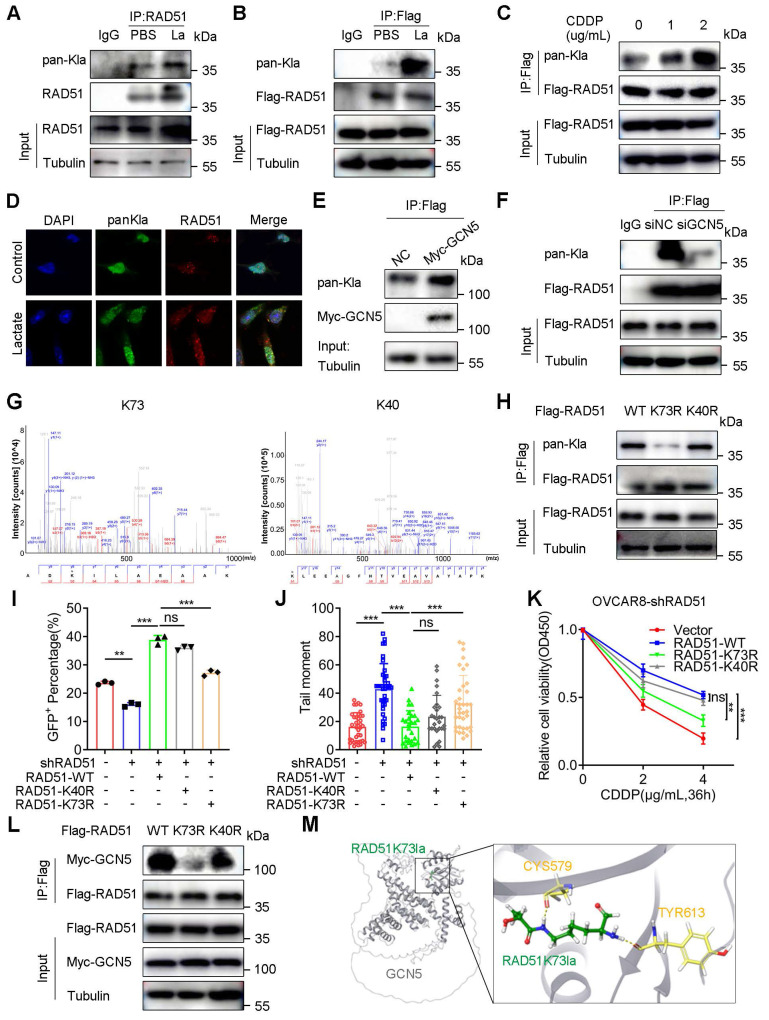
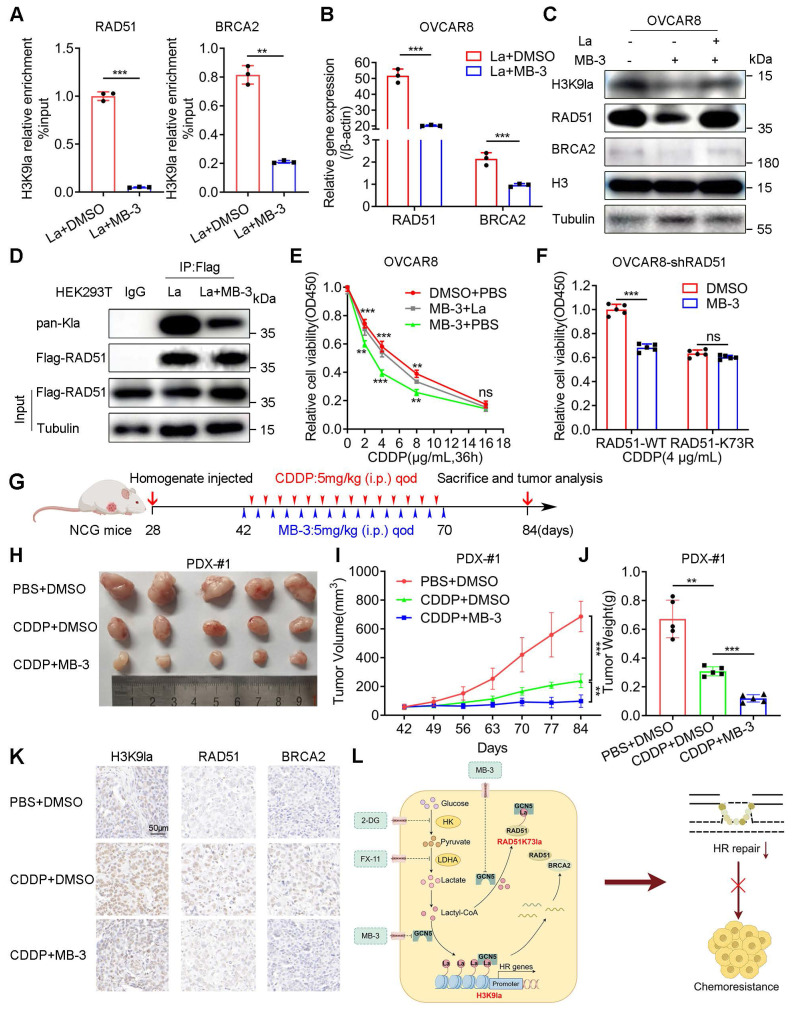
Rationale: Ovarian cancer is a highly lethal gynecological malignancy with common platinum resistance. Lactylation is involved in multiple biological processes. Thus, we explored the role of histone and non-histone lactylation in platinum resistance, providing a potential therapeutic target to overcome platinum resistance in ovarian cancer. Methods: We utilized gene set enrichment analysis to investigate lactylation-related pathway alterations between platinum-resistant and platinum-sensitive patients from the TCGA cohort. Differential expression of H3K9la was demonstrated using Western blotting and immunohistochemistry. Progression-free and overall survival were determined using a log-rank test. Drug response to cisplatin was evaluated by CCK8, apoptosis flow cytometry, and clonogenic assays in vitro. ChIP-seq and ChIP-qPCR assays were performed to identify downstream targets of H3K9la, which was further confirmed by qRT-PCR. LC-MS/MS was conducted to identify specific lactylation sites for RAD51. Co-IP was used to reveal the interaction between GCN5 and H3K9la or RAD51la. Cell line-derived and patient-derived xenograft (PDX) models of ovarian cancer were constructed for the in vivo experiments. Results: Our study showed elevated histone lactylation, especially of H3K9la, in platinum-resistant ovarian cancer. Moreover, high H3K9la indicated platinum resistance and poor prognosis of ovarian cancer. Impairing H3K9la enhanced response to cisplatin. Mechanistically, H3K9la directly activated RAD51 and BRCA2 expression to facilitate homologous recombination (HR) repair. Furthermore, RAD51K73la enhanced HR repair and subsequently conferred cisplatin resistance. H3K9la and RAD51K73la shared the same upstream regulator, GCN5. Notably, a GCN5 inhibitor remarkably improved the tumor-killing ability of cisplatin in PDX models of ovarian cancer. Conclusions: Our study demonstrated the essential role of histone and RAD51 lactylation in HR repair and platinum resistance. It also identified a potential therapeutic strategy to overcome platinum resistance and improve prognosis in ovarian cancer.

Keywords: HR repair; RAD51; lactylation; ovarian cancer; platinum resistance.


Conflict of interest statement

Competing Interests: The authors have declared that no competing interest exists.

Figures

Figure 1
Figure 1
Histone lactylation was associated with platinum resistance and predicted poor prognosis in ovarian cancer. A. GSEA analysis of the “HALLMARK_GLYCOLYSIS” gene set between platinum-resistant and -sensitive ovarian cancer groups in the TCGA cohort. B. Intracellular lactate level in CDDP-resistant and -sensitive cells. C. Detection of pan-Kla and several site-specific histone lactylation in CDDP-resistant and control cells by Western blotting. D. Detection of pan-Kla and H3K9la levels in platinum-resistant and -sensitive samples from the Qilu Hospital cohort by Western blotting. Student's t-test was used to validate the difference in H3K9la gray values. E. Representative IHC images of H3K9la in ovarian cancer tissues. Scale bars are in the lower right corner. F. Chi-square assay to compare the platinum-resistance and -sensitive proportion in H3K9la-high and -low groups in ovarian cancer from the Qilu Hospital cohort. G and H. OS (G) and PFS (H) of H3K9la-high and H3K9la-low groups from the Qilu Hospital cohort. I. Western blotting to detect H3K9la alteration in A2780 and OVCAR8 cells pretreated with CDDP for 36 h. * p < 0.05; ** p < 0.01; *** p < 0.001; ns, no significant change.
Figure 2
Figure 2
Glycolysis inhibitors decreased the H3K9la level and increased the response to CDDP. A and B. pan-Kla or H3K9la levels in OVCAR8 cells treated with different lactate concentrations (A) or rotenone (B) detected by Western blotting. C. Schematic diagram of glycolysis and key target inhibitors. D and E. Intracellular lactate levels in OVCAR8 cells treated with 2-DG (D), FX-11 (E), or La (10 mM). F and G. Alteration of pan-Kla or H3K9la levels regulated by 2-DG (F), FX-11 (G) and/or La (10 mM) detected by Western blotting. H and I. 2-DG (1 mM) (H) or FX-11 (20 μM) (I) impaired the relative cell viability of OVCAR8 cells exposed to CDDP, which was reversed by La (10 mM), in the CCK8 assay. J and K. Colony formation in OVCAR8 cells exposed to CDDP when cells were pretreated with 2-DG (1 mM) (J), FX-11(20 μM) (K), or La (10 mM). L and M. 2-DG (1 mM) (L) or FX-11 (20 μM) (M) increased the apoptotic cell ratio (%) induced by CDDP (2 μg/ml), which was reversed by La (10 mM) in OVCAR8 cells. * p < 0.05; ** p < 0.01; *** p < 0.001; ns, no significant change.
Figure 3
Figure 3
H3K9la enhanced HR repair by activating RAD51 and BRCA2 expression. A. ChIP intensity signal of H3K9la was distributed near the TSS. B and C. DDR-related GO (B) and KEGG (C) analysis of H3K9la-enriched downstream candidate genes. D. IGV tracks of the ChIP signal of candidate target genes. Black arrows indicated the peak regions. E. ChIP-qPCR analysis of promoters in target genes performed using anti-H3K9la in A2780 or A2780/DDP cells. F-H. ChIP-qPCR analysis of the indicated promoters in H3K9la-enriched genes in OVCAR8 cells treated with La (10 mM) (F), 2-DG (1 mM) (G), or FX-11(20 μM) (H). I. Increased RAD51 and BRCA2 protein levels by La by Western blotting. J and K. Western blotting of RAD51 and BRCA2 protein levels in OVCAR8 cells treated with 2-DG (J), FX-11 (K), or La (10 mM). L. Diagram of the DR-GFP reporter system consisting of pCBAScel and pDR-GFP plasmids. M. Fluorescence-activated cell sorting of OVCAR8 cells receiving different treatments by flow cytometry (La:10 mM). N. Comet assays (left) and quantification of tail moment (right) in OVCAR8 cells treated with10 mM La. * p < 0.05; **p < 0.01; ***p < 0.001; ns, no significant change.
Figure 4
Figure 4
GCN5 regulated H3K9la and was associated with poor prognosis and platinum resistance. A. Inhibitory efficiency of siRNAs of three potential lactylation writers for H3K9la by Western blotting. B. Interaction mode between H3K9la peptide (purple) and GCN5 (gray) by the molecular docking assay. Several residues (yellow) accommodate the H3K9la group. C. Immunofluorescence co-staining for H3K9la and GCN5 in A2780 cells with/without lactate (10 mM). D and E. Western blotting of co-IP between H3K9la and GCN5 in CDDP-sensitive and -resistant cells following treatment with CDDP (1 μg/ml). F and G. Effect of GCN5 siRNA on the H3K9la level in OVCAR8 cells treated with lactate (F) or rotenone (G) by Western blotting. H. Representative IHC images of GCN5 and the Pearson correlation analysis between H3K9la and GCN5 in patients with ovarian cancer. Scale bars are in the lower right corner. I and J. Survival analysis between ovarian cancer patients with low and high GCN5 levels in the TCGA cohort, including OS (I) and PFS (J). K. K-M Plotter online analysis of PFS in ovarian cancer between low and high GCN5 groups. L. TPM level comparison of GCN5 in platinum-sensitive or -resistant patients from the TCGA cohort. M. Comparison of GCN5 expression in GSE206649 public data. N. GCN5 protein level in CDDP-resistant or control cells by Western blotting. O. GCN5 expression alteration in cells exposed to different CDDP concentrations by Western blotting. * p < 0.05; ** p < 0.01; *** p < 0.001; ns, no significant change.
Figure 5
Figure 5
GCN5 conferred CDDP resistance by augmenting H3K9la and its downstream target gene expression. A. ChIP-qPCR analysis of H3K9la-targeted genes in OVCAR8 cells transfected with GCN5 siRNA and treated with lactate (10 mM) as indicated. B. qRT-PCR analysis of mRNA levels of H3K9la-targeted genes in OVCAR8 cells with shGCN5 or control pLKO.1. C. Western blotting assay for H3K9la-targeted genes in ovarian cancer cells with upregulated or downregulated GCN5. D. Effect of GCN5 on the CDDP response in OVCAR8 cells by the CCK8 assay (La: 10 mM). E. Relative cell viability in A2780 cells treated with 2-DG (1 mM) or FX-11 (20 μM) by The CCK8 assay. F and G. Interfering efficiency of siRNA for RAD51 (F) and BRCA2 (G) in A2780-pCMV-GCN5 cells by Western blotting (left). Relative cell viability by the CCK8 assay in different groups as indicated (right). H. In vivo tumor formation assay in BALB/c nude mice. I. Subcutaneous tumors obtained from different groups. J. Comparison of tumor volumes in different CDX groups on indicated days. K. Comparison of tumor weights of different CDX groups. L. Representative IHC-staining images of GCN5, H3K9la, RAD51, and BRCA2 from tumor tissues of Figure 5I. Scale bar: 40 μm. * p < 0.05; ** p < 0.01; *** p < 0.001; ns, no significant change.
Figure 6
Figure 6
RAD51K73la mediated CDDP resistance by enhancing HR repair, which could be regulated by GCN5. A and B. Lactylation of endogenous (A) or exogenous (B) RAD51 protein by co-IP and Western blotting (La: 10 mM). C. Lactylation level alteration of RAD51 in cells treated with different CDDP concentrations by co-IP and Western blotting. D. Immunofluorescence co-staining for RAD51 and pan-Kla in A2780 cells with/without lactate (10 mM). E and F. Increased or decreased RAD51 lactylation with GCN5 overexpression (E) or interference (F) by co-IP and Western blotting. G. Potential RAD51 lactylation sites identified by LC-MS/MS. H. RAD51 lactylation in cells transfected with WT, K73R, or K40R vectors by co-IP and Western blotting. I. Fluorescence-activated cells were sorted by flow cytometry in OVCAR8-shRAD51 cells transfected with RAD51 WT, K73R, or K40R vectors. GFP+ rates were calculated and compared. J. Tail moment analysis of the treated cells from Figure 6I in comet assay. K. CCK8 assay of OVCAR8-shRAD51 cells transfected with WT, K73R, or K40R vectors in and treated with different CDDP concentrations. L. Interaction between GCN5 and RAD51 in HEK293T cells transfected with WT, K73R, or K40R RAD51 vectors by co-IP and Western blotting. M. Interaction mode between RAD51K73la peptide (green) and GCN5 (gray) in the molecular docking assay: several residues (yellow) accommodate the RAD51K73la group. * p < 0.05; ** p < 0.01; *** p < 0.001; ns, no significant change.
Figure 7
Figure 7
GCN5 inhibitor MB-3 sensitized ovarian cancer to CDDP by impairing H3K9la and RAD51K73la. A. ChIP-qPCR analysis of H3K9la-targeted genes in OVCAR8 treated with MB-3 (30 μM) or DMSO. B. qRT-PCR of mRNA levels of H3K9la-targeted genes in OVCAR8 cells treated with MB-3 (30 μM) or DMSO. C. Regulation of H3K9la level and its downstream genes by MB-3 (30 μM). D. Effect of MB-3 on RAD51 lactylation by co-IP and Western blotting (La:10 mM, MB-3: 30 μM). E. Killing efficiency of CDDP in OVCAR8 cells treated with MB-3 or lactate as indicated (La:10 mM, MB-3: 30 μM) by the CCK8 assay. F. Cell viability in OVCAR8-shRAD51 cells transfected with WT or K73R vectors and exposed to CDDP (MB-3: 30 μM) by the CCK8 assay. G. Diagram of PDX model construction, treatment, and tumor analysis in ovarian cancer. H. Tumor images of differently treated groups in PDX-#1. I. Tumor volumes in different PDX-#1 groups on indicated days. J. Tumor weights in different PDX-#1 groups. K. Evaluation of H3K9la, RAD51, and BRCA2 expression from tumor tissues of Figure 7H by IHC. L. Graphical abstract of the study. * p < 0.05; ** p < 0.01; *** p < 0.001; ns, no significant change.

References

    1. Siegel RL, Miller KD, Wagle NS, Jemal A. Cancer statistics, 2023. CA Cancer J Clin. 2023;73:17–48. - PubMed
    1. Sung H, Ferlay J, Siegel RL, Laversanne M, Soerjomataram I, Jemal A. et al. Global Cancer Statistics 2020: GLOBOCAN Estimates of Incidence and Mortality Worldwide for 36 Cancers in 185 Countries. CA Cancer J Clin. 2021;71:209–49. - PubMed
    1. Peres LC, Cushing-Haugen KL, Kobel M, Harris HR, Berchuck A, Rossing MA. et al. Invasive Epithelial Ovarian Cancer Survival by Histotype and Disease Stage. J Natl Cancer Inst. 2019;111:60–8. - PMC - PubMed
    1. Richardson DL, Eskander RN, O'Malley DM. Advances in Ovarian Cancer Care and Unmet Treatment Needs for Patients With Platinum Resistance: A Narrative Review. JAMA Oncol. 2023;9:851–9. - PubMed
    1. Lheureux S, Gourley C, Vergote I, Oza AM. Epithelial ovarian cancer. Lancet. 2019;393:1240–53. - PubMed

MeSH terms