. 2025 Feb 10;15(7):2991-3012.
doi: 10.7150/thno.106469. eCollection 2025.

TFEB promotes Ginkgetin-induced ferroptosis via TRIM25 mediated GPX4 lysosomal degradation in EGFR wide-type lung adenocarcinoma

Affiliations

TFEB promotes Ginkgetin-induced ferroptosis via TRIM25 mediated GPX4 lysosomal degradation in EGFR wide-type lung adenocarcinoma

Hao-Jie Wang et al. Theranostics. .

Abstract

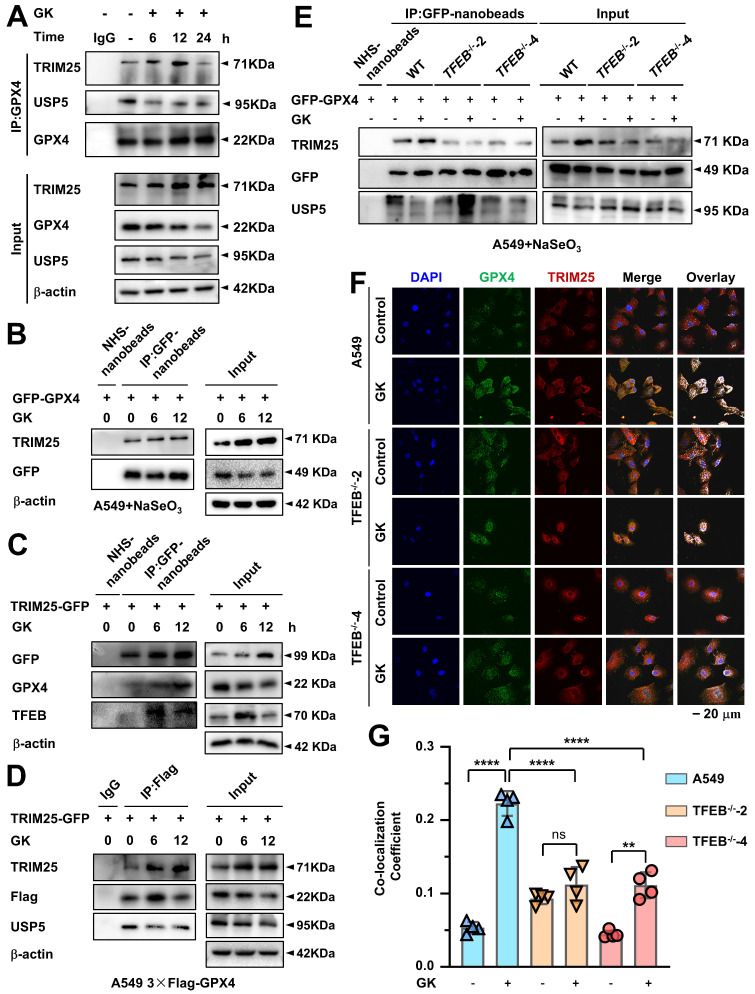
Rationale: TFEB activation is associated with prolonged survival in LUAD patients, suggesting potential benefits of TFEB agonists in LUAD treatment. In this study, we identify ginkgetin (GK), derived from Ginkgo folium, as a natural TFEB agonist, which has demonstrated promising anticancer effects in our previous research. TFEB activation has been shown to promote GPX4 degradation, inducing ferroptosis; however, the specific E3 ligases, deubiquitinating enzymes (DUBs), and types of polyubiquitination chains involved remain unclear. The unique mechanisms associated with natural compounds like GK may help elucidate the underlying biological processes. Here, we describe a novel biological event involved in the lysosomal degradation of GPX4 induced by TFEB activation through the utilization of GK. Methods: TFEB activation was induced with GK, and TFEB knockout cells were generated using CRISPR-Cas9. The activity of TFEB and its relationship with ferroptosis were assessed by immunoprecipitation, labile iron pool and lysosomal activity assays. The types of polyubiquitination chains, E3 ligases, and DUBs involved in GPX4 degradation were analyzed using LC-MS, immunoprecipitation, and immunofluorescence. These findings were further validated in an orthotopic xenograft SCID mouse model. Results: GK binds to and activates TFEB, leading to TFEB-mediated lysosomal activation and GPX4 degradation, which induces ferroptosis in LUAD cells. These effects were impaired in TFEB knockout cells. Mechanistically, K48-linked polyubiquitination of GPX4 was required for GK induced GPX4 lysosomal translocation. TFEB knockout reduced both K48-linked ubiquitination and lysosomal translocation of GPX4. Additionally, GK promotes the binding of TFEB and TRIM25. TRIM25 and USP5 were found to competitively bind to GPX4, with TFEB activation favoring TRIM25 binding to GPX4 and reducing the interaction of USP5 and GPX4. These findings were confirmed in a xenograft SCID mouse model using TFEB knockout LUAD cells. Conclusion: This study identifies, for the first time, GK as a promising TFEB agonist for LUAD treatment. TFEB activation promotes TRIM25-mediated K48-linked polyubiquitination and lysosomal degradation of GPX4, driving ferroptosis. This ferroptosis-driven mechanism offers a novel strategy to enhance ferroptosis-based anti-LUAD therapies.

Keywords: LUAD; TFEB; ferroptosis; ginkgetin; lysosome; ubiquitination.


Conflict of interest statement

Competing Interests: The authors have declared that no competing interest exists.

Figures

Figure 1
Figure 1
GK binds to TFEB and induces TFEB activation. (A) The binding affinity of GK to TFEB was determined by the SPR assay. TFEB protein was immobilized on a CM5 chip, then GK solution flowed over. The concentrations shown are ranging from 100 µM to 0.41 µM with three times dilution. (B) Data from (A) were fitted to the Langmuir equation, the dissociation constant (Kd) was determined using the steady-state model. (C) Cells were transfected with pcDNA3.1-GFP or pcDNA3.1-TFEB-GFP and subsequently lysed. The lysates were incubated with various concentrations of GK for 15 min. The binding affinity between TFEB and GK was measured using a High-Sensitivity Microscale Thermophoresis Detection System. The normalized binding curve of TFEB and GK is presented, with the binding curve yielding a Kd of 2.8 × 10⁻⁵ M. (D) LUAD cells (A549 and SPC-A-1) were treated with GK for 6, 12, 24, and 48 h. Western blot was conducted to analyze the protein levels of TFEB, p-TFEB (Ser122), p-TFEB (Ser211), and 14-3-3. (E) The cytoplasmic and nuclear protein of LUAD cells (A549 and SPC-A-1) were extracted after 24 h GK treatment. The protein expression of TFEB in each fraction were investigated by western blot. β-actin was served as the marker of cytoplasm, while Lamin A serves as the marker of nucleus. (F) The semi-quantitative analysis of TFEB protein expression in (E). n = 3, *P < 0.05, ****P < 0.0001. (G) LUAD cells (A549 and SPC-A-1) were treated with GK for 24 h, the nuclear translocation of TFEB was observed by immunofluorescence. Scale bar = 20 μM. (H) The co-localization was analyzed by Olympus Fluoview FV31S-DT software. Co-localization coefficients from (G) were calculated by measuring the co-localizing pixels between TFEB (green fluorescence) and DAPI (blue fluorescence) relative to the total number of pixels for the nuclei (DAPI channel). n = 4, *P < 0.05, ****P < 0.0001.
Figure 2
Figure 2
GK promotes lysosome activation. (A) LUAD cells (A549 and SPC-A-1) were treated with GK (15 μM) for 24 h. Following treatment, cells were harvested, and mRNA was extracted and subsequently reverse transcribed into cDNA. The mRNA level of CTSD, ATP6V0D1 and MCOLN1 were detected by qPCR. (B) LUAD cells (A549 and SPC-A-1) were treated with GK for 24, 48 h, then labeled with LysoTracker™ Red DND-99 (50 nM) for 30 min. Fluorescence intensity of 10,000 cells per sample was measured by flow cytometry. The fluorescence intensity of the cells was displayed in histograms (left panel), and the relative changes in mean fluorescence intensity (MFI) compared to the control group was quantified (right panel). (C) LUAD cells (A549 and SPC-A-1) were treated same as in (B), then stained with Magic Red for 30 min. The level of cathepsin B was analyzed by flow cytometry. Fluorescence intensity of 10,000 cells per sample was analyzed. The fluorescence intensity of the cells was displayed in histograms (left panel), and the relative changes in mean fluorescence intensity (MFI) compared to the control group was quantified (right panel). n = 3, **P < 0.01, ***P < 0.001, ****P < 0.0001.
Figure 3
Figure 3
TFEB is positively related to GK induced lysosome activation. (A) A549 WT cells and TFEB knockout cells (TFEB-/--2, TFEB-/--4) were treated with GK for 24 h, then stained with Magic Red for 30 min. The level of cathepsin B was analyzed by flow cytometry. Fluorescence intensity of 10,000 cells per sample was analyzed. (B) Cells were treated same as in (A). Cells was labeled with LysoTracker™ Red DND-99 (50 nM) for 30 min. Fluorescence intensity of 10,000 cells per sample was measured by flow cytometry. (C) A549 cells were transfected with TFEB or mock-transfected with pcDNA3.1, then treated with GK for 24 h. The measurement of cathepsin B levels was performed as described in (A). (D) The transfection and GK treatment were performed as described in (C), and the detection of lysosomal activity was conducted as described in (B). The fluorescence intensity of the cells was displayed in histograms (left panel), and the relative changes in mean fluorescence intensity (MFI) compared to the control group was quantified (right panel). n = 3, **P < 0.01, ***P < 0.001, ****P < 0.0001.
Figure 4
Figure 4
GK promotes GPX4 lysosomal degradation and K48-linked ubiquitination. (A) A549 cells were treated with GK (15 μM) for 24, 48 h. The cells were harvested, and mRNA was extracted and reverse transcribed into cDNA. The mRNA level of GPX4 was investigated by qPCR. n = 3. (B) A549 cells were treated with CHX (1 μg/mL), CHX+GK (1 μg/mL + 15 μM) for 6, 12, 24 h, the protein expression of GPX4 was observed by western blot. (C) A549 cells were treated with GK (15 μM) in the absence or presence of CQ (20 μM), BaFA1(160 nM) for 24 h. The protein expression of GPX4 was observed by western blot. (D) A549 cells were treated with GK (15 μM) for 24 h. The cells were harvest and the lysosome fraction was extracted by lysosome isolation kit. The protein expression of HSC70, GPX4 in both lysosome and lysosome free fractions were detected by western blot. LAMP1 serves as lysosome marker, and β-actin was serves as a marker for lysosome free fraction. (E) A549 cells were treated as described in (D), and the co-localization of GPX4 and LAMP1 was observed by immunofluorescence. Scale bar = 20 µM. (F) The co-localization was analyzed by Olympus Fluoview FV31S-DT software. The co-localization coefficient was determined from (E). n = 5, **P < 0.01. (G) A549 cells were treated with GK for 12, 24, 48 h, cells were collected and lysed. 100 μg of the cell lysates of each sample were subdivided and used as input control. The left cell lysates were subjected to immunoprecipitation via protein G beads and GPX4 antibody. Immunoprecipitated protein complexes and input were analyzed by western blot using GPX4, ubiquitin, LAMP2A, and HSC70 antibodies. (H) A549 cells were transfected with HA-Ub, HA-K63 or HA-K48, then each transcription group was treated with GK for 12 h. Then cells were harvest and lysed. 100 μg of the cell lysates of each sample were subdivided and used as input control. The left cell lysates were subjected to immunoprecipitation via protein G beads and GPX4 antibody. Immunoprecipitated protein complexes and input were analyzed by western blot using GPX4, HSC70, and HA antibodies. (I) A549 cells were co-transfected with HA-K48 and Myc-USP2, or HA-K48 and pcDNA3.1. Subsequently, each transcription group was either treated or untreated with GK for 12 h. The cells were collected and lysed, then performed immunoprecipitation assay as in (G). Immunoprecipitated protein complexes and input were analyzed by western blot using GPX4, LAMP2A, K48-linkage specific polyubiquitin and Myc antibodies. (J) The transfection and drug treatment were same as in (I). The co-localization of LAMP2 and GPX4 were observed via immunofluorescence. Scale bar = 20 µM. (K) The co-localization was analyzed by Olympus Fluoview FV31S-DT software. The co-localization coefficient from (J) was calculated by determining the number of colocalized pixels of GPX4 (red fluorescence) with LAMP2 (green fluorescence) relative to the total number of LAMP2 pixels. Scale bar = 20 μM. n = 4, **P < 0.01.
Figure 5
Figure 5
TFEB promotes GK induced GPX4 lysosomal degradation. (A) A549 cells and TFEB knockout A549 cells (TFEB-/--2, TFEB-/--4) were treated with GK (15 μM) for 24 h. The protein expression of GPX4 was determined by western blot. (B) TFEB knockout cells (TFEB-/--2, TFEB-/--4) were transfected with TFEB-Myc or mock transfected with pcDNA3.1, followed by a 24 h treatment with GK. The protein levels of TFEB and GPX4 were then analyzed by western blot. (C) A549 cells and TFEB knockout A549 cells (TFEB-/--2, TFEB-/--4) were treated with GK (15 μM) for 24 h. The cells were harvested, and lysosomes were extracted using a lysosome isolation kit. The protein level of GPX4, both in the lysosomal and lysosome free fractions, was investigated by western blotting. LAMP1 serves as a lysosomal marker, and β-actin serves as a marker for the lysosome free fraction. (D) A549 cells and TFEB knockout A549 cells (TFEB-/--2, TFEB-/--4) were treated with GK for 12 h, the co-localization of GPX4 and LAMP2 was observed via confocal microscopy. (E) The co-localization was analyzed by Olympus Fluoview FV31S-DT software. Co-localization coefficient was calculated by the colocalized pixels of GPX4 (red fluorescence) and LAMP2 (green fluorescence) relative to the total pixels of LAMP2. Scale bar = 15 μm. n = 5, ****P < 0.0001. (F) Flag-GPX4 stably transfected cells were transfected with HA-K48, then treated with GK (15 μM) for 12 h. 100 μg of the cell lysates of each sample were subdivided and used as input control. The left cell lysates were harvested and lysed, then performed immunoprecipitation via Flag antibody and protein G beads. The expression of K48-linked polyubiquitin, flag-GPX4 and LAMP2A in immunoprecipitants and input were investigated by western blot. (G) A549 cells and TFEB knockout A549 cells (TFEB-/--2, TFEB-/--4) were transfected with HA-K48, then treated with GK (15 μM) for 12 h. The left cell lysates were harvested and lysed, then performed immunoprecipitation via GPX4 antibody and protein G beads. The expression of K48-linked polyubiquitin, GPX4 in immunoprecipitants and input were investigated by western blot.
Figure 6
Figure 6
TFEB promotes GK induced binding of GPX4 and TRIM25. (A) A549 cells were treated with GK (15 μM) for 6, 12, and 24 h. After treatment, the cells were harvested and lysed. A portion (100 μg) of each cell lysate was used as input control. The remaining lysates were subjected to immunoprecipitation using protein G beads and GPX4 antibody. Both the immunoprecipitated fractions and input controls were analyzed by western blot with GPX4, TRIM25, and USP5 antibodies. (B) A549 cells were transfected with GFP-GPX4 and supplemented with NaSeO₃ (1 μM). The cells were treated with GK for 6, 12 h, then collected and lysed. A portion (100 μg) of each cell lysate was used as input control, while the remaining lysates were subjected to immunoprecipitation using GFP-nanobeads. The protein levels of GFP-GPX4 and TRIM25 in the immunoprecipitated fractions and input controls were analyzed by western blot. (C) A549 cells were transfected with TRIM25-GFP and treated with GK for 6, 12 h. Immunoprecipitation was performed as described in (B). The immunoprecipitated fractions and input controls were analyzed by western blot using GFP, GPX4, and TFEB antibodies. (D) TRIM25-GFP was transfected into A549 cells stably expressing 3×Flag-GPX4. Cell treatments were performed as described in (B). Immunoprecipitation was conducted as outlined in (C). The immunoprecipitated fractions and input controls were analyzed by western blot using TRIM25, Flag, and USP5 antibodies. (E) A549 cells and TFEB knockout A549 cells (TFEB-/--2, TFEB-/--4) were transfected with GFP-GPX4. Each transfection group was treated with GK (15 μM) for 12 h. Immunoprecipitation was performed as described in (B). The immunoprecipitated fractions and input controls were analyzed by western blot using TRIM25, GFP, and USP5 antibodies. (F) A549 cells and TFEB knockout A549 cells (TFEB-/--2, TFEB-/--4) were treated GK (15 μM) for 12 h. The co-localization of GPX4 and TRIM25 was observed by immunofluorescence assay. (G) The co-localization of GPX4 and TRIM25 was analyzed using Olympus Fluoview FV31S-DT software. Co-localization was calculated based on the number of colocalized pixels of GPX4 (green fluorescence) and TRIM25 (red fluorescence) relative to the total number of pixels for GPX4 (green fluorescence). Scale bar = 20 μM. n = 4, **P < 0.01, ****P < 0.0001.
Figure 7
Figure 7
GK promotes ferroptosis in LUAD cells. (A) LUAD cells (A549 and SPC-A-1) were treated with GK (15 μM) for 48 h in the presence and absence of Ferrostatin-1 or liproxstatin-1. The proliferation inhibition of the cells was observed by MTT assay. n = 4, *P < 0.05, ***P < 0.001, ****P < 0.0001. (B) LUAD cells (A549 and SPC-A-1) were treated with GK (15 μM) for 6, 12, 24, 48 h. The protein levels of SLC7A11, GPX4, and FTH were observed by western blot. β-actin served as internal control. (C-D) LUAD cells (A549 and SPC-A-1) were treated with GK (15 μM) for 24, 48 h. The cells were collected and stained with BODIPY™ 581/591 C11 (10 μM) for 30 min. The level of lipid peroxidation was observed by flow cytometry (λexc =488 nm) (C). LUAD cells (A549 and SPC-A-1) were treated with GK (15 μM) for 24 h, CA-AM was added to cells at the final concentration of 0.5 µM, followed by adding iron chelator deferiprone (DFP, 100 μM) for 1 h or left untreated. The level of LIP was detected by flow cytometry (λexc=488 nm) (D). 10,000 cells for each sample were analyzed. Left panel: The fluorescence intensity of the cells was displayed in histograms. Right panel: Relative changes in mean fluorescence intensity (MFI) (C) or ΔMFI (D) compared to the control group. n = 3, **P < 0.01, ****P < 0.0001.
Figure 8
Figure 8
GK induced ferroptosis compromised by TFEB knockout. (A) A549 cells and TFEB knockout A549 cells (TFEB-/--2, TFEB-/--4) were treated with GK (15 μM) for 24 h. The cells were collected and stained with BODIPY™ 581/591 C11 (10 μM) for 30 min. The level of lipid peroxidation was observed by flow cytometry (λexc = 488 nm), 10,000 cells for each sample were analyzed. Histograms represents the fluorescence intensity of the cells. (B) The relative changes in mean fluorescence intensity (MFI) for each treatment group compared to the control group, quantified from (A). n = 3, **P < 0.01, ****P < 0.0001. (C) A549 cells and TFEB knockout A549 cells (TFEB-/--2, TFEB-/--4) were treated with GK (15 μM) for 24 h. Then the cells were stained with CA-AM (0.5 µM), followed by iron chelator deferiprone (DFP, 100 μM) for 1 h or left untreated. The level of LIP was detected by flow cytometry (λexc = 488 nm), 10,000 cells for each sample were analyzed. Histograms represents the fluorescence intensity of the cells. (D) The relative LIP level of each treated sample compared to the WT control group calculated from (C). n = 3, *P < 0.05, **P < 0.01, ****P < 0.0001. (E) A549 cells were transfected with TFEB-Myc or mock transfected with pcDNA3.1, then treated with GK (15 μM) for 48 h. The proliferation inhibition of the cells was observed by MTT assay. n = 4, *P < 0.05, ****P < 0.0001. (F) A549 cells were mock transfected with pcDNA3.1, TFEB knockout A549 cells (TFEB-/--2, TFEB-/--4) were transfected with TFEB-Myc or mock transfected with pcDNA3.1. Then each transfection group was treated with GK (15 μM) for 48 h. The proliferation inhibition of the cells was observed by MTT assay. n = 5, ****P < 0.0001.
Figure 9
Figure 9
TFEB knockout compromised GK induced anticancer effect. A549-luci or A549TFEB KO-luci cells were injected into the right lung of male NOD/SCID mice. Five days post-implantation, the mice were randomized into four groups, each comprising six mice. The mice implanted with A549-luci or A549 TFEB KO-luci cells were administered GK (120 mg/kg) for 21 days. Following treatment, the mice were euthanized, and tumor tissue samples were either snap-frozen at -80 °C or fixed in 4% paraformaldehyde (PFA) for subsequent immunofluorescence (IF) or immunohistochemistry (IHC) analysis. Experimental procedures were conducted as detailed in the Materials and Methods section. (A) Representative bioluminescence images were captured at specified time points (Day 0, Day 8, Day 15, and Day 21) following GK administration. (B) Bioluminescence intensity in mice, expressed in radiance (Ph/s), with n = 6, **P < 0.01, ****P < 0.0001. (C) Immunohistochemical staining analysis showing PCNA-positive cells stained brown and nuclei stained blue. Representative images from each group are presented. (D) Each tumor tissue section was randomly chosen to determine the mean Integrated Optical Density (IOD) value of the positively stained region using Image Pro Plus software, reflecting PCNA expression levels. Scale bar = 50 μm. n = 4. *P < 0.05. (E) The co-localization of GPX4 and LAMP1 in tumor tissues was assessed using immunofluorescence. Scale bar = 20 μm. (F) Co-localization of GPX4 and TRIM25 in tumor was detected by immunofluorescence. Scale bar = 20 μm. (G) Co-localization coefficients from (E) were calculated by Olympus Fluoview FV31S-DT software. Co-localization coefficient was calculated by the colocalized pixels of GPX4 (red fluorescence) and LAMP1 (green fluorescence) relative to the total pixels of LAMP1. n = 5. **P < 0.01. (H) Co-localization coefficients from (F) were calculated by Olympus Fluoview FV31S-DT software. Co-localization coefficient was calculated based on the number of colocalized pixels of GPX4 (green fluorescence) and TRIM25 (red fluorescence) relative to the total number of pixels for GPX4 (green fluorescence). n = 4. *P < 0.05, ***P < 0.001.

References

    1. Lam S, Bai C, Baldwin DR, Baldwin DR, Chen Y, Connolly C. et al. Current and Future Perspectives on Computed Tomography Screening for Lung Cancer: A Roadmap From 2023 to 2027 From the International Association for the Study of Lung Cancer. J Thorac Oncol. 2024;19(1):36–51. - PMC - PubMed
    1. He S, Xia C, Li H, Cao M, Yang F, Yan X. et al. Cancer Profiles in China and Comparisons with the USA: A Comprehensive Analysis in the Incidence, Mortality, Survival, Staging, and Attribution to Risk Factors. Sci China Life Sci. 2024;67(1):122–31. - PubMed
    1. Tian X, Gu T, Lee MH, Dong Z. Challenge and Countermeasures for EGFR Targeted Therapy in Non-Small Cell Lung Cancer. Biochim Biophys Acta Rev Cancer. 2022;1877(1):188645. - PubMed
    1. Xu JY, Zhang C, Wang X, Zhai L, Ma Y, Mao Y. et al. Integrative Proteomic Characterization of Human Lung Adenocarcinoma. Cell. 2020;182(1):245–61. - PubMed
    1. Papke B, Der CJ. Drugging RAS: Know the Enemy. Science. 2017;355(6330):1158–63. - PubMed

MeSH terms

Substances