. 2025 Feb 10;15(7):2967-2990.
doi: 10.7150/thno.104752. eCollection 2025.

LCN2 deficiency mitigates the neuroinflammatory damage following acute glaucoma

Affiliations

LCN2 deficiency mitigates the neuroinflammatory damage following acute glaucoma

Tu Hu et al. Theranostics. .

Abstract

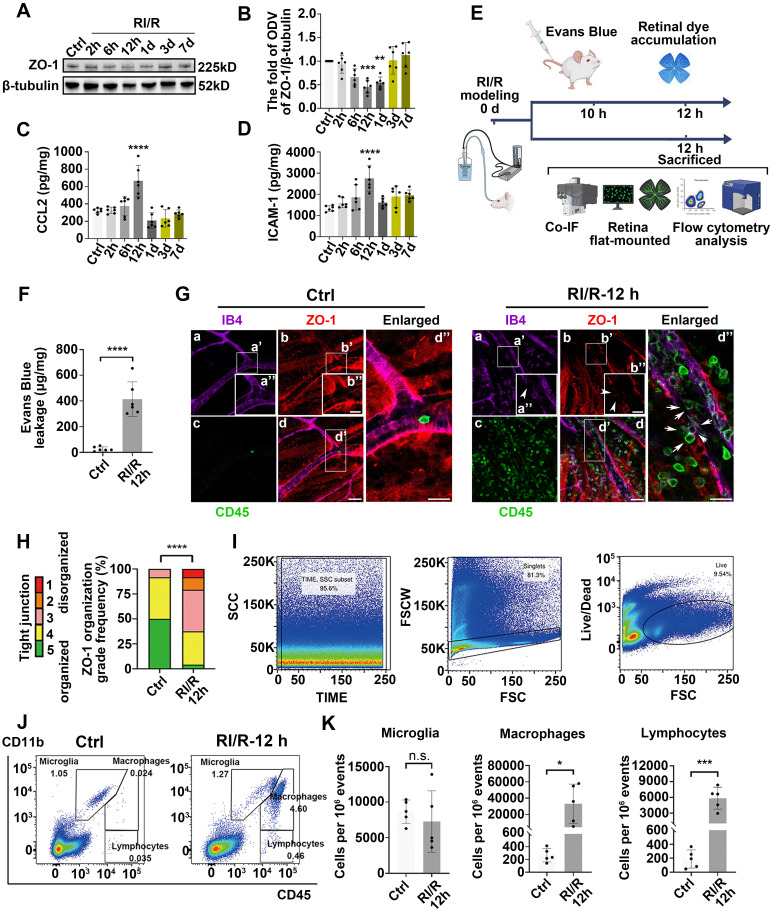
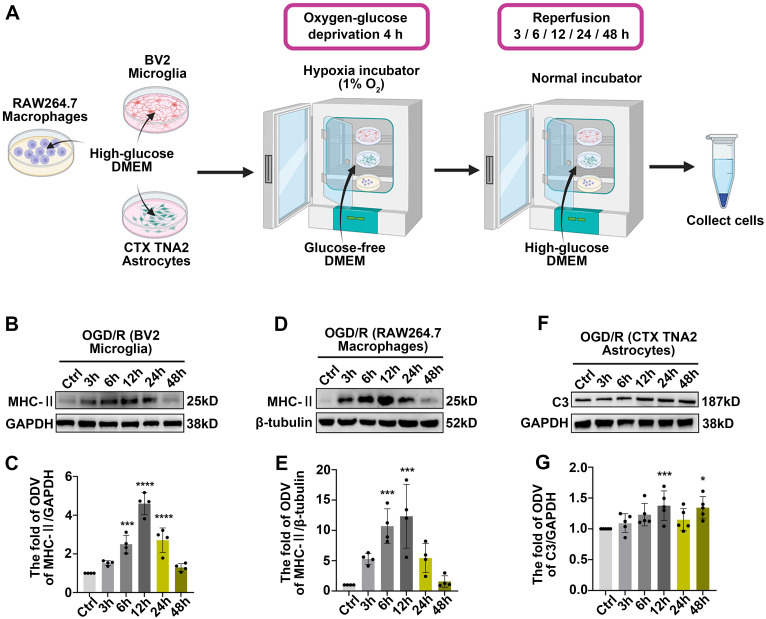
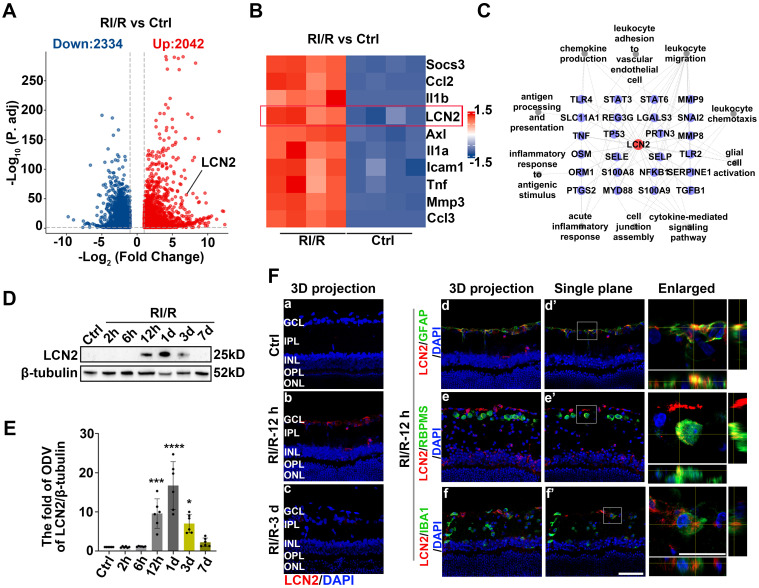
Rationale: Acute high intraocular pressure (IOP) induces retinal ischemia/reperfusion (RI/R) that further initiates neuroinflammatory responses. This event can cause retinal tissue damage and neuronal death, ultimately resulting in irreversible blindness worldwide that lacks effective therapies, validated treatment targets and underlying mechanisms. We sought to explore the potential mechanisms on the causal link between the neuroinflammatory response and neurodegeneration following acute high IOP. Methods: A rat model of RI/R induced by acute high IOP was used to investigate the spatiotemporal profiles of blood-retinal barrier (BRB) disruption, peripheral immune cell infiltration, and innate immune cell response following acute glaucomatous injury. RNA sequencing and in vivo transfection with adeno-associated virus (AAV) were used to explore the pathogenic mechanisms of acute high IOP-induced neuroinflammation. Results: Disruption of the inner BRB and infiltration of macrophages and lymphocytes occurred during the early stage after acute high IOP. These events were accompanied by an innate immune response. RNA sequencing revealed that Lipocalin-2 (Lcn2) was one of the most significantly up-regulated inflammation-related genes. Lcn2 knockdown ameliorated inner BRB disruption, peripheral immune cell infiltration, and innate immune cell response, resulting in neuroprotective effects. Furthermore, we found that acute glaucomatous injury triggers high expression of LCN2 in the peripheral serum, which is strongly associated with the severity of the neuroinflammatory response in the retina. Conclusions: A "neuroinflammatory cascade" characterized by breakdown of inner BRB, peripheral immune cell infiltration, and innate immune cell response occurs during the initial stage following glaucomatous injury. We also identified a novel mechanism for LCN2 in acute high IOP-induced neuroinflammation. LCN2 has the potential to serve as a candidate biomarker for predicting the severity of the neuroinflammatory response following acute glaucoma, which may provide new evidence to retinal repair strategies for better visual function recovery at intervention time points and new targets.

Keywords: blood-retinal barrier; glaucoma; innate immune cell response; lipocalin-2; peripheral immune cells infiltration.


Conflict of interest statement

Competing Interests: The authors have declared that no competing interest exists.

Figures

Figure 1
Figure 1
RNA-sequencing revealed the functional biological processes affected by RI/R injury at the early stages. A: Diagram revealed that up-regulated levels of inflammatory cytokines occurred earlier than RGCs loss following RI/R injury. RNA-sequencing of rat's retinae was performed at 12 h after RI/R to explore the potential mechanism underlying retinal inflammation. B: PCA of retina samples from control and RI/R groups (n = 4 per group). C: Heatmap and unsupervised hierarchical clustering of DEGs from control and RI/R retinae. Scale represented z-score values of fragments per kilobase of exon per million (FPKM). D: GO Biological Brocess (BP) enrichment of DEGs. E: GSEA for enriched GO BP. NES: normalized enrichment score.
Figure 2
Figure 2
Early-stage breakdown of the blood-retinal barrier (BRB) and infiltration of peripheral immune cells following RI/R injury. A: Western blotting showed the changes in ZO-1 expression in retinae following RI/R. B: Bar graph depicted the fold of optical density value (ODV) of ZO-1 in each group (n = 6). C, D: ELISA showed the protein levels of CCL2 and ICAM-1 in rat retinae of each group (n = 6). E: Schematic diagram of experimental workflow for detecting the BRB disruption and peripheral infiltration. F: Bar graph depicted the retinal Evans blue (EB) dye accumulation in control and RI/R 12 h group (n = 6). G: Immunofluorescence images showed IB4 (green), ZO-1 (red), and CD45 (magenta) of superficial vascular regions of normal retinae and RI/R-injured retinae at 12 h after injury. Arrows indicate regions where the vessel is exhibiting disorganization of endothelial tight junction (TJ) complexes and apparent extravasation of CD45+ leukocytes. H: Histograms represented the evaluation of TJ continuity at endothelial cell borders using a blinded rank (1-5) scoring system. In the graph, green indicated completely continuous, yellow indicated 75% to 100% continuous, pink indicated 50% to 75% continuous, orange indicated 25% to 50% continuous, and red indicated 0% to 25% continuous border staining. For each retina, four images equidistant from the optic disc were averaged with n = 6 retinae for each condition. I, J: Representative scatter-graphs showed the flow-cytometric analysis used to quantify immune cell populations in the retina. After gating for single cells, events were gated into CD11b+/CD45med cells (resident-microglia), CD11b+/CD45hi (myeloid leukocytes) and CD11bneg/CD45hi cells (non-myeloid leukocytes, aka lymphocytes). K: Flow-cytometric analysis was used to quantify resident microglia, myeloid leukocyte and aka lymphocyte populations in each group (n = 4). Data in B-D, F, H, K were represented as mean ± SD; * p < 0.05, ***p < 0.001, ****p < 0.0001 (compared with the control group using one-way analysis of variance). Bar = 50 μm in Ga-Gd, bar = 20 μm in Ga”-Gd”.
Figure 3
Figure 3
Innate immune cell response following RI/R injury. A: Western blotting showed the changes in MHC-II expression in retinae following RI/R. B: Western blotting showed the changes in C3 expression in retinae following RI/R. C: Bar graphs depicted the fold of ODV of MHC-II in retinae (n = 5). D: Bar graphs depicted the fold of ODV of C3 in retinae (n = 6). E: Immunofluorescence images showed the morphological alteration of IBA1 (grey) positive cells, infiltration of IBA1 (grey)/CCR2 (red) positive macrophages and distribution of MHC-II (green) in rat retinae and in IBA1+CCR2- microglia/ IBA1+CCR2+ macrophages following RI/R. F: Bar graph depicted the percentage of morphological phenotypes (ramified, ameboid, hypertrophic) in IBA1 positive cells in each group (n = 6). G: Bar graphs depicted the number of IBA1+CCR2- and IBA1+CCR2+ cells in each group (n = 6). H: Bar graphs depicted the number of IBA1+CCR2-MHC-II+ and IBA1+CCR2+MHC-II+ cells in each group (n = 6). I: Immunofluorescence images showed the morphological alteration of GFAP (green) positive cells, the distribution of C3 (red) in rat retinae, and co-staining of GFAP and C3 (orange) following RI/R. J: Bar graph depicted the fluorescent intensity of C3 in inner retinae in each group (n = 6). K: Bar graph depicted the colocalized voxels of C3/GFAP staining in inner retinae in each group (n = 6). Data in C, D, G, H, J, K were represented as mean ± SD; *p < 0.05, **p < 0.01, ****p < 0.0001, ####p < 0.0001 (compared with the control group using one-way analysis of variance). ####p < 0.0001 in G, H for IBA1+CCR2-MHC-II+ cells comparison; **p < 0.01, ****p < 0.0001 in G, H for IBA1+CCR2+ and IBA1+CCR2+MHC-II+ cells comparison. Bar = 50 μm in Ea-Ed, Ia-Id, Ia'-Id', bar = 20 μm in enlarged images. GCL: ganglion cell layer, IPL: inner plexiform layer, INL: inner nuclear layer, OPL: outer plexiform layer, ONL: outer nuclear layer, ROI: region of interest.
Figure 4
Figure 4
Innate immune cell response after OGD/R injury. A: Diagram of OGD/R in vitro model. B: Western blotting showed the changes in MHC-II expression in BV2 microglia following OGD/R. C: Bar graphs depicted the fold of ODV of MHC-II in BV2 microglia (n = 4). D: Western blotting showed the changes in MHC-II expression in RAW264.7 macrophages following OGD/R. E: Bar graphs depicted the fold of ODV of MHC-II in RAW264.7 macrophages (n = 4). F: Western blotting showed the changes in C3 expression in CTX TNA2 astrocytes following OGD/R. G: Bar graphs depicted the fold of ODV of C3 in CTX TNA2 astrocytes (n = 5). Data in C, E, G were represented as mean ± SD; ***p < 0.001, ****p < 0.0001 (compared with the control group using one-way analysis of variance).
Figure 5
Figure 5
LCN2 rapidly up-regulated following RI/R injury and might have an intimate relationship with BRB disruption, peripheral infiltration, and activation of retinal glial cells. A, B: Volcano plot and heatmap showed that LCN2 was one of the highly up-regulated inflammation-related genes at 12 h after RI/R C: The interaction diagram depicted that LCN2 interacted with proteins belonging to enriched GO terms following RI/R. D: Western blotting showed the changes in LCN2 expression in retinae following RI/R. E: Bar graph depicted the fold of ODV of LCN2 in each group (n=6). F: Immunofluorescence images showed the distribution of LCN2 (red) in rat retinae and colocalization of LCN2 with GFAP/RBPMS/IBA1 (green) following RI/R injury. Data in E were represented as mean ± SD; *p < 0.05, ***p < 0.001, ****p < 0.0001 (compared with the control group using one-way analysis of variance). Bar = 50 μm in Fa-Ff, Fd'-Ff', bar = 20 μm in enlarged images. GCL: ganglion cell layer, IPL: inner plexiform layer, INL: inner nuclear layer, OPL: outer plexiform layer, ONL: outer nuclear layer.
Figure 6
Figure 6
LCN2 shRNA-AAV treatment ameliorated the disruption of BRB, and infiltration of peripheral immune cells. A: Diagram presents the research workflow. B: Western blotting showed the changes in ZO-1 expression following LCN2 shRNA-AAV treatment, compared to the RI/R group. C: Bar graph depicted the fold of ODV of ZO-1 in each group (n = 6). D: Bar graph depicted the retinal Evans blue dye accumulation following LCN2 shRNA-AAV treatment, compared to the RI/R group (n = 6). E, F: ELISA showed the protein level of CCL2 and ICAM-1 in rat retinae of each group (n = 6). G: Histograms represent the evaluation of TJ continuity at endothelial cell borders using a blinded rank (1-5) scoring system. In the graph, green indicates completely continuous, yellow indicates 75% to 100% continuous, pink indicates 50% to 75% continuous, orange indicates 25% to 50% continuous, and red indicates 0% to 25% continuous border staining. For each retina, four images equidistant from the optic disc were averaged with n = 6 retinae for each condition. H: Immunofluorescence images showed IB4 (green), ZO-1 (red), and CD45 (magenta) of superficial vascular regions of RI/R-injured retina, RI/R+LCN2 shRNA treated retinae and RI/R+shNC treated retinae at 12 h after injury. Arrows indicate regions where the vessel is exhibiting disorganization of endothelial TJ complexes and apparent extravasation of CD45+ leukocytes. I: Representative scatter-graphs showing the flow-cytometric analysis used to quantify immune cell populations in the retina. After gating for single cells, events were gated into CD11b+/CD45med cells (resident-microglia), CD11b+/CD45hi (myeloid leukocytes) and CD11bneg/CD45hi cells (non-myeloid leukocytes, aka lymphocytes). J: Flow-cytometric analysis was used to quantify resident microglia, myeloid leukocyte and aka lymphocyte populations in each group (n = 5). Data in C-F, J were represented as mean ± SD; *p < 0.05, **p < 0.01, ***p < 0.001, n.s.: no significance, (compared with the RI/R group using Student t-test analysis of variance). Bar = 50 μm in Ha-Hd, bar = 20 μm in Ha”-Hd”.
Figure 7
Figure 7
LCN2 shRNA-AAV treatment suppressed the innate immune cell response. A: Western blotting showed the changes in MHC-II expression following LCN2 shRNA-AAV treatment, compared to the RI/R group. B: Bar graphs depicted the fold of ODV of MHC-II in each group (n = 6). C: Immunofluorescence images showed the morphological alteration of IBA1 (grey) positive cells, infiltration of IBA1 (grey)/CCR2 (red) positive macrophages and distribution of MHC-II (green) in rat retinae and in IBA1+CCR2- microglia/IBA1+CCR2+ macrophages following RI/R. D: Bar graph depicted the percentage of morphological phenotypes (ramified, ameboid, hypertrophic) in IBA1 positive cells in each group (n = 6). E: Bar graphs depicted the number of IBA1+CCR2- and IBA1+CCR2+ cells in each group (n = 6). F: Bar graphs depicted the number of IBA1+CCR2-MHC-II+ and IBA1+CCR2+MHC-II+ cells in each group (n = 6). G: Western blotting showed the changes in C3 expression following LCN2 shRNA-AAV treatment, compared to the RI/R group. H: Bar graphs depicted the fold of ODV of C3 in each group (n = 6). I: Immunofluorescence images showed the morphological alteration of GFAP (green) positive cells, the distribution of C3 (red) in rat retinae, and co-staining of GFAP and C3 (orange) following LCN2 shRNA-AAV treatment. J: Bar graph depicted the fluorescent intensity of C3 in inner retinae in each group (n = 6). K: Bar graph depicted the colocalized voxels of C3/GFAP staining in inner retinae in each group (n = 6). Data in B, E, F, H, J, K were represented as mean ± SD; ***p < 0.001, ****p < 0.0001, n.s.: no significance, (compared with the RI/R group using Student t-test). Bar = 50 μm in Ca-Cc, Ha-Hc, Ha'-Hc', bar = 20 μm in enlarged images. GCL: ganglion cell layer, IPL: inner plexiform layer, INL: inner nuclear layer, OPL: outer plexiform layer, ONL: outer nuclear layer, ROI: region of interest.
Figure 8
Figure 8
LCN2 shRNA-AAV treatment down-regulated the expression of proinflammatory cytokines following RI/R injury and exhibited a neuroprotective effect on the retinae. A: Schematic diagram of experimental workflow. B, C: ELISA showed the protein level of TNF and IL-1β in rat retinae following LCN2 shRNA-AAV treatment, compared to the RI/R group (n = 6). D: Immunofluorescence images showed the number of RBPMS-positive RGCs in rat retinae following LCN2 shRNA-AAV treatment, compared to the RI/R group. E: Bar graph depicted the number of RBPMS-positive RGCs per mm2 in each group (n = 6). F: TUNEL tests showed the apoptosis in rat retinae following following LCN2 shRNA-AAV treatment, compared to the RI/R group. G: Bar graph depicted the TUNEL positive cells in each group (n = 6). H: Visual function following RI/R with LCN2 shRNA-AAV treatment were measured by f-VEP test. I, J: Bar graphs depicted the amplitude of N2-P2 and the latency of P2 in each group (n = 6). Data in B, C, E, G, I, J were represented as mean ± SD; *p < 0.05, **p < 0.01, ***p < 0.001, ****p < 0.0001, n.s.: no significance, (compared with the control group/the RI/R group using Student t-test). Bar = 100 μm in Db-De, Bar = 50 μm in Fa-Fi. GCL: ganglion cell layer, IPL: inner plexiform layer, INL: inner nuclear layer, OPL: outer plexiform layer, ONL: outer nuclear layer.
Figure 9
Figure 9
Molecular mechanisms underlying Lcn2 knockdown in RI/R retina. A: PCA of retina samples from RI/R, RI/R+shNC and RI/R+shLCN2 groups (n = 4-6 per group). B: Heatmap and unsupervised hierarchical clustering of DEGs from RI/R, RI/R+shNC and RI/R+shLCN2 retinae. Scale represents z-score values of FPKM. C: Volcano plot shows DEGs in RI/R+shLCN2 versus RI/R+shNC group. D: GSEA for KEGG pathways. E: GSEA for Apoptosis pathways. G: The interaction diagram of genes belonging to the selected KEGG pathways: Chemokine signaling pathway, Leukocyte transendothelial migration, Antigen processing and presentation, Toll-like receptor signaling pathway, JAK-STAT signaling pathway and Complement and coagulation cascades. Orange dotted lines represent KEGG pathways. Grey solid lines represent genes-encoding protein interactions between different proteins. Black solid lines represent proteins directly interacted with LCN2. The size of nodes represents the number of protein interactions. The color bar from red to blue indicates the fold change of gene expression level from increasing to decreasing. NES: normalized enrichment score.
Figure 10
Figure 10
Serum LCN2 was significantly up-regulated following acute glaucomatous injury and was associated with the severity of retinal neuroinflammatory response. A: Diagram of serum sampling. B: ELISA showed the protein level of LCN2 in serum of rats following RI/R (n = 5). C: ELISA showed the protein level of LCN2 in serum of glaucomatous and non-glaucomatous patients (n = 16). D-J: Linear correlation between serum LCN2 protein levels and retinal TNF (D), IL-1β (E), CCL2 (F), ICAM-1 (G), MHC-Ⅱ (H), C3 (I) and ZO-1 (J) protein levels in RI/R rats. Data in D, F-H were represented as mean ± SD; *p < 0.05, **p < 0.01, ****p < 0.0001 (compared with the control group using one-way analysis of variance, compared with the non-glaucomatous group using Student t-test).

References

    1. Bingsong W, Nathan C, Rupert B, Yichong L, Kai C, Aiping Z. et al. Burden of vision loss associated with eye disease in china 1990-2020: findings from the global burden of disease study 2015. Br J Ophthalmol. 2017;102:220–224. - PubMed
    1. Yih-Chung T, Xiang L, Tien Y W, Harry A Q, Tin A, Ching-Yu C. Global prevalence of glaucoma and projections of glaucoma burden through 2040: a systematic review and meta-analysis. Ophthalmology. 2014;121:2081–90. - PubMed
    1. Xiaolu Z, Wen Z, Shengyu W, Xiaomin C, Tian Z, Min K. Measurement of retinal changes in primary acute angle closure glaucoma under different durations of symptoms. J Ophthalmol. 2019;2019:5409837. - PMC - PubMed
    1. Alessia P, Filippo D, Stefano G. Protecting the retinal neurons from glaucoma: lowering ocular pressure is not enough. Pharmacol Res. 2012;66:19–32. - PubMed
    1. Mohammadali A, Ariel M W, Barbara M, Jorge Luis CV, Adriana DP. The molecular basis of retinal ganglion cell death in glaucoma. Prog Retin Eye Res. 2011;31:152–81. - PubMed

MeSH terms