. 2025:3:imag_a_00444.
doi: 10.1162/imag_a_00444. Epub 2025 Jan 6.

Arterial spin labelling perfusion MRI analysis for the Human Connectome Project Lifespan Ageing and Development studies

Affiliations

Arterial spin labelling perfusion MRI analysis for the Human Connectome Project Lifespan Ageing and Development studies

Thomas F Kirk et al. Imaging Neurosci (Camb). 2025.

Abstract

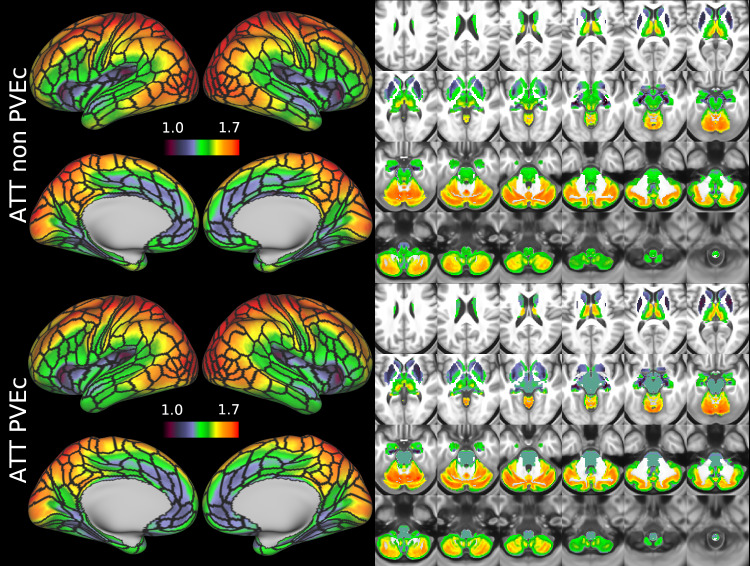
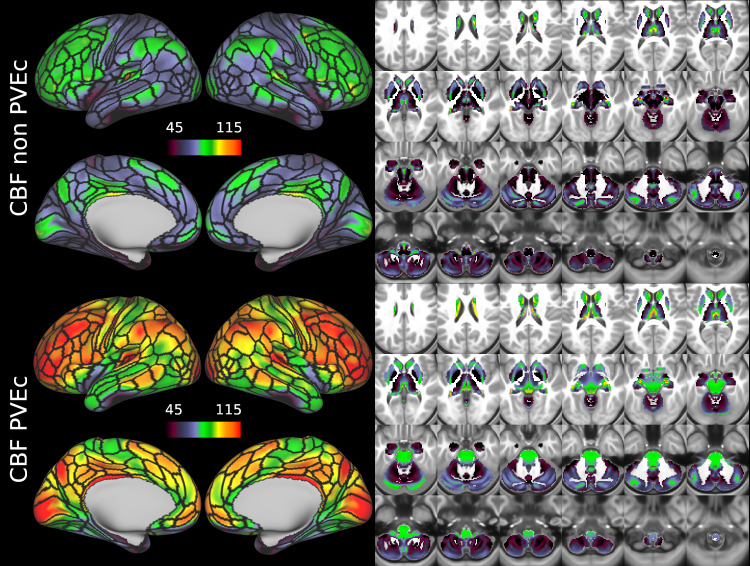
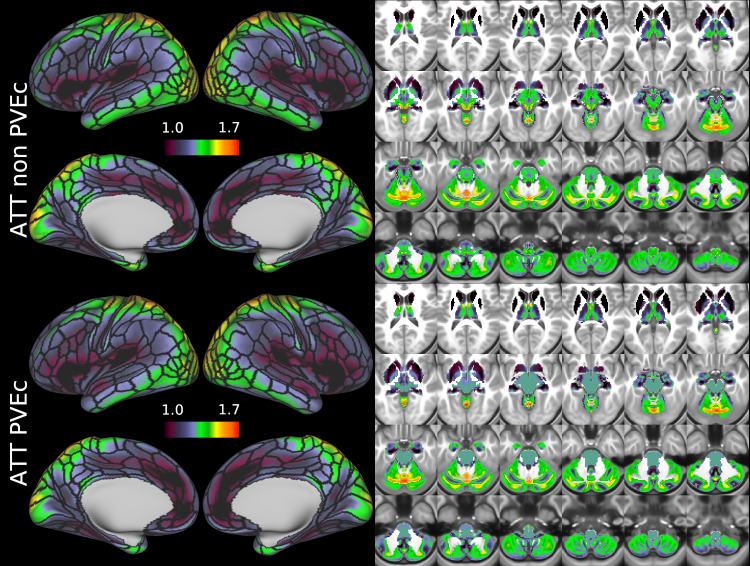
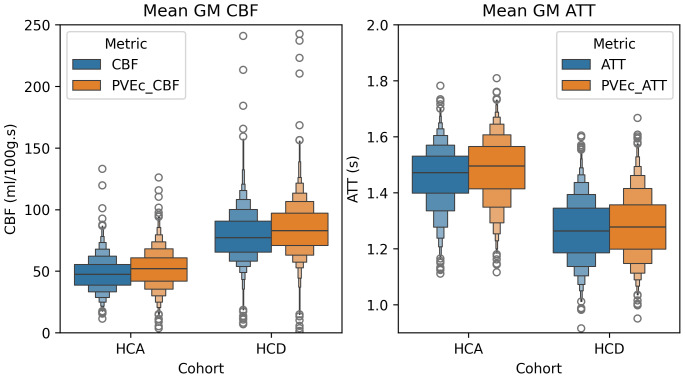
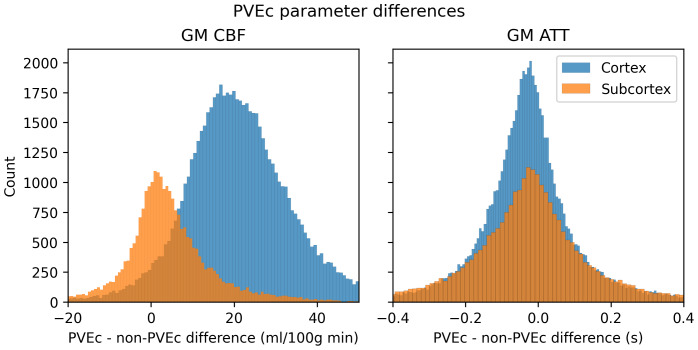
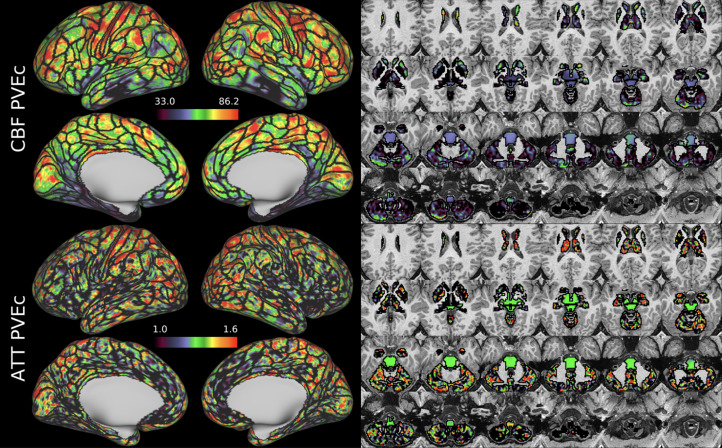
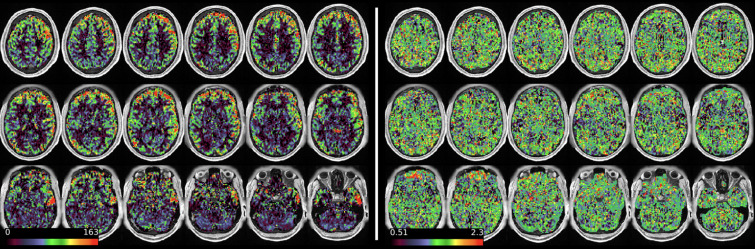
The Human Connectome Project Lifespan studies cover the Development (5-21) and Aging (36-100+) phases of life. Arterial spin labelling (ASL) was included in the imaging protocol, resulting in one of the largest datasets collected to-date of high spatial resolution multiple delay ASL covering 3,000 subjects. The HCP-ASL minimal processing pipeline was developed specifically for this dataset to pre-process the image data and produce perfusion estimates in both volumetric and surface template space, though quality control is not performed. Applied to the whole dataset, the outputs of the pipeline revealed significant and expected differences in perfusion between the Development and Ageing cohorts. Visual inspection of the group average surface maps showed that cortical perfusion often followed cortical areal boundaries, suggesting differential regulation of cerebral perfusion within brain areas at rest. Group average maps of arterial transit time also showed differential transit times in core and watershed areas of the cerebral cortex, which are useful for interpreting haemodynamics of functional MRI images. The pre-processed dataset will provide a valuable resource for understanding haemodynamics across the human lifespan.

Keywords: Perfusion; ageing; arterial spin labelling (ASL); arterial transit time (ATT); cerebral blood flow (CBF); human connectome project (HCP).


Conflict of interest statement

The authors declare no competing interests.

Figures

Fig. 1.
Fig. 1.
Banding artefact visible on the calibration image (top row) and last volume of the ASL timeseries (bottom row). The bottom of each band (six in total) is shown with an arrowhead.
Fig. 2.
Fig. 2.
Schematic diagram showing how the fully corrected calibration and ASL images in ASL-gridded T1 space are derived (green box). Note that some intermediate registrations and transformations are not shown for clarity (particularly in the orange shaded box); all operations applied to the fully corrected outputs are shown. SEBASED: spin-echo based, SDC: susceptibility distortion correction, GDC: gradient distortion correction, MC: motion correction, FABBER: FSL model-fitting tool, MCFLIRT: FSL motion correction tool.
Fig. 3.
Fig. 3.
Perfusion analysis applied to ASL difference data after alignment with the individual’s T1w image. Bayesian inference is used to produce both partial volume-corrected and non-corrected estimates of perfusion and arterial arrival times, as well as arterial cerebral blood volume estimates. During inference, the slice-timing image on the right is used to produce slice-specific PLDs. Calibration of perfusion measures was performed using CSF reference region calibration.
Fig. 4.
Fig. 4.
Workbench scene produced by the pipeline to assess registration and masking accuracy. The FreeSurfer white and pial surfaces are shown via thin green and blue lines, respectively. The ASL volumetric brain mask outline is shown in magenta. The white box denotes the field of view of the ASL acquisition, transformed into the ASL-gridded T1 w space. The cyan line (seen at bottom of cerebellum in the sagittal view) denotes a section of the ASL brain mask that lies outside the field of view. The base image in greyscale is the first volume of the fully corrected ASL timeseries image.
Fig. 5.
Fig. 5.
Magnitude of the two multiplicative banding corrections according to slice number and PLD/volume number within the ASL timeseries. First panel: the empirical banding correction applies equally to all PLDs/volumes within the ASL timeseries. Second panel: the saturation recovery correction is stronger for early PLDs than later ones (0.2 s vs. 1.2 s vs. 2.2 s, respectively) and operates in the opposite direction to the empirical banding correction. Final panel: when the two corrections are combined, they almost cancel each other in early PLDs and have a stronger effect in later PLDs (due to the reduced magnitude of the saturation recovery correction).
Fig. 6.
Fig. 6.
Banding artefacts visible in the first (0.2 s), third (1.2 s), and final (2.2 s) PLDs of the ASL timeseries. First column: before correction, visible banding varies according to PLD, because the saturation recovery mechanism affects each PLD differently. Second column: saturation recovery correction in isolation is unable to remove all banding at any PLD. Third column: the empirical banding correction in isolation does not remove banding in the early PLDs but does so in later PLDs. Fourth column: at all PLDs, the combination of the two banding corrections better removes banding than in isolation. The images in all columns are single volumes from the corresponding PLD group, and were previously corrected for gradient non-linearity distortion, susceptibility distortion, and the receive-coil bias field.
Fig. 7.
Fig. 7.
Group average CBF maps (in ml/100 g/min) for the HCA cohort in the cortex and subcortical structures. PVEc led to substantial increases in CBF in the cortical ribbon; the increase was less pronounced in the subcortex.
Fig. 8.
Fig. 8.
Group average ATT maps (in seconds) for the HCA cohort in the cortex and subcortical structures. PVEc did not lead to notable changes in ATT.
Fig. 9.
Fig. 9.
Group average CBF maps for the HCD cohort in the cortex and subcortical structures. PVEc led to substantial increases in CBF in the cortical ribbon; the increase was less pronounced in the subcortex.
Fig. 10.
Fig. 10.
Group average ATT maps for the HCD cohort in the cortex and subcortical structures. PVEc did not lead to notable changes in ATT.
Fig. 11.
Fig. 11.
Group average CBF and ATT maps without PVEc for the HCA cohort in volumetric representation.
Fig. 12.
Fig. 12.
Group average CBF and ATT maps without PVEc for the HCD cohort in volumetric representation.
Fig. 13.
Fig. 13.
Mean GM CBF and ATT across individuals without and with PVEc for the two cohorts.
Fig. 14.
Fig. 14.
The effect of PVEc on CBF (left) and ATT (right), shown as a histogram of differences in cortical and subcortical greyordinates for a single HCD subject. In the cortex, the mean increase in CBF was around 15 ml/100 g/min, whereas in the subcortex, the increase was around 5 ml/100 g/min. For ATT, the mean difference was close to 0 s and there was no substantial difference in the distribution between cortical and subcortical greyordinates.
Fig. 15.
Fig. 15.
CBF and ATT maps (with PVEc) in the cortex and subcortical structures for subject HCD0378150 of the HCD cohort.
Fig. 16.
Fig. 16.
shows the same individual and measures asFigure 15represented as IDPs using the HCP multi-modal parcellation’s cortical areas and major subcortical structures.
Fig. 17.
Fig. 17.
Volumetric CBF (left) and ATT (right, both non-PVEc) maps for subject HCD0378150 of the HCD cohort.

References

    1. Alosco , M. L. , Gunstad , J. , Jerskey , B. A. , Xu , X. , Clark , U. S. , Hassenstab , J. , Cote , D. M. , Walsh , E. G. , Labbe , D. R. , Hoge , R. , Cohen , R. A. , & Sweet , L. H. ( 2013. ). The adverse effects of reduced cerebral perfusion on cognition and brain structure in older adults with cardiovascular disease . Brain and Behavior , 3 ( 6 ), 626 – 636 . 10.1002/brb3.171 - DOI - PMC - PubMed
    1. Alsop , D. C. , Detre , J. A. , Golay , X. , Günther , M. , Hendrikse , J. , Hernandez-Garcia , L. , Lu , H. , Macintosh , B. J. , Parkes , L. M. , Smits , M. , Van Osch , M. J. P. , Wang , D. J. J. , Wong , E. C. , & Zaharchuk , G. ( 2015. ). Recommended implementation of arterial spin-labeled Perfusion MRI for clinical applications: A consensus of the ISMRM Perfusion Study group and the European consortium for ASL in dementia . Magnetic Resonance in Medicine . 10.1002/mrm.25197 - DOI - PMC - PubMed
    1. Avants , B. B. , Duda , J. T. , Kilroy , E. , Krasileva , K. , Jann , K. , Kandel , B. T. , Tustison , N. J. , Yan , L. , Jog , M. , Smith , R. , Wang , Y. , Dapretto , M. , & Wang , D. J. J. ( 2015. ). The pediatric template of brain perfusion . Scientific Data , 2 ( 1 ), 150003 . 10.1038/sdata.2015.3 - DOI - PMC - PubMed
    1. Binnewijzend , M. A. A. , Benedictus , M. R. , Kuijer , J. P. A. , van der Flier , W. M. , Teunissen , C. E. , Prins , N. D. , Wattjes , M. P. , van Berckel , B. N. M. , Scheltens , P. , & Barkhof , F. ( 2016. ). Cerebral perfusion in the predementia stages of Alzheimer’s disease . European Radiology , 26 ( 2 ), 506 – 514 . 10.1007/s00330-015-3834-9 - DOI - PMC - PubMed
    1. Bookheimer , S. Y. , Salat , D. H. , Terpstra , M. , Ances , B. M. , Barch , D. M. , Buckner , R. L. , Burgess , G. C. , Curtiss , S. W. , Diaz-Santos , M. , Elam , J. S. , Fischl , B. , Greve , D. N. , Hagy , H. A. , Harms , M. P. , Hatch , O. M. , Hedden , T. , Hodge , C. , Japardi , K. C. , Kuhn , T. P. ,… Yacoub , E. ( 2019. ). The Lifespan Human Connectome Project in aging: An overview . NeuroImage , 185 , 335 – 348 . 10.1016/j.neuroimage.2018.10.009 - DOI - PMC - PubMed

LinkOut - more resources