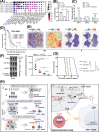
. 2025 Jun;45(6):677-701.
doi: 10.1002/cac2.70016. Epub 2025 Mar 14.

Blocking ITGA5 potentiates the efficacy of anti-PD-1 therapy on glioblastoma by remodeling tumor-associated macrophages

Affiliations

Blocking ITGA5 potentiates the efficacy of anti-PD-1 therapy on glioblastoma by remodeling tumor-associated macrophages

Rongrong Zhao et al. Cancer Commun (Lond). 2025 Jun.

Abstract

Background: Glioblastoma (GBM) is largely refractory to antibodies against programmed cell death 1 (anti-PD-1) therapy. Fully understanding the cellular heterogeneity and immune adaptations in response to anti-PD-1 therapy is necessary to design more effective immunotherapies for GBM. This study aimed to dissect the molecular mechanisms of specific immunosuppressive subpopulations to drive anti-PD-1 resistance in GBM.

Methods: We systematically analysed single-cell RNA sequencing and spatial transcriptomics data from GBM tissues receiving anti-PD-1 therapy to characterize the microenvironment alterations. The biological functions of a novel circular RNA (circRNA) were validated both in vitro and in vivo. Mechanically, co-immunoprecipitation, RNA immunoprecipitation and pull-down assays were conducted.

Results: Mesenchymal GBM (MES-GBM) cells, which were associated with a poor prognosis, and secreted phosphoprotein 1 (SPP1)+ myeloid-derived macrophages (SPP1+ MDMs), a unique subpopulation of MDMs with complex functions, preferentially accumulated in non-responders to anti-PD-1 therapy, indicating that MES-GBM cells and SPP1+ MDMs were the main anti-PD-1-resistant cell subpopulations. Functionally, we determined that circular RNA succinate dehydrogenase complex assembly factor 2 (circSDHAF2), which was positively associated with the abundance of these two anti-PD-1-resistant cell subpopulations, facilitated the formation of a regional MES-GBM and SPP1+ MDM cell interaction loop, resulting in a spatially specific adaptive immunosuppressive microenvironment. Mechanically, we found that circSDHAF2 promoted MES-GBM cell formation by stabilizing the integrin alpha 5 (ITGA5) protein through N-glycosylation. Meanwhile, the N-glycosylation of the ITGA5 protein facilitated its translocation into exosomes and subsequent delivery to MDMs to induce the formation of SPP1+ MDMs, which in turn maintained the MES-GBM cell status and induced T-cell dysfunction via the SPP1-ITGA5 pathway, ultimately promoting GBM immune escape. Importantly, our findings demonstrated that antibody-mediated ITGA5 blockade enhanced anti-PD-1-mediated antitumor immunity.

Conclusions: This work elucidated the potential tissue adaptation mechanism of intratumoral dynamic interactions between MES-GBM cells, MDMs and T cells in anti-PD-1 non-responders and identified the therapeutic potential of targeting ITGA5 to reduce anti-PD-1 resistance in GBM.

Keywords: Anti‐PD‐1 therapy; N‐glycosylation; exosomes; glioblastoma; intergrins; tumor‐associated macrophages.


Conflict of interest statement

The authors declare that they have no known competing financial interests or personal relationships that could have appeared to influence the work reported in this paper.

Figures
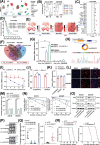
FIGURE 1
FIGURE 1
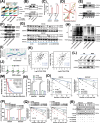
circSDHAF2 promoted MES‐GBM cell formation and tumorigenesis. (A) UMAP plots depicting 10 cell types in GBM samples treated with anti‐PD‐1, analyzed by scRNA‐seq. Batch effects were corrected using the R package Harmony. (B) Proportions of each cell type, with each dot representing a patient. P values were calculated using a two‐sided Dirichlet‐multinomial regression model. (C) Association between marker gene expression (continuous) and patient survival in the TCGA‐GBM dataset. Weighted Z‐scores are represented by points and a horizontal dashed line at 0, determined via linear regression. (D) Kaplan‐Meier survival curves of four TCGA‐GBM patient subgroups stratified by MES‐GBM cell and hypoxic MDM infiltration. (E) Spatial feature plots showing MES‐GBM and hypoxic MDM signature scores in anti‐PD‐1‐treated GBM tissues. (F) Venn diagram illustrating overlapping upregulated circRNAs (Log2 FC > 1) in tumors with high MES‐GBM, hypoxic MDM, and immune score. (G) Expression levels of circSDHAF2 in PN (GSC11 and GSC8‐11) and MES (GSC20 and GSC267) GSC subtypes (n  =  3). (H) Genomic location and back‐splicing of circSDHAF2, validated by Sanger sequencing. (I) Stability of circSDHAF2 and SDHAF2 mRNA in GSC20 and GSC267 cells analyzed after Actinomycin D treatment. (J) Stability of circSDHAF2 and SDHAF2 mRNA in GSC20 and GSC267 cells assessed after RNase R treatment. (K) Nuclear‐cytoplasmic fractionation assays indicating cytoplasmic localization of circSDHAF2 in GSC20 and GSC267 cells. (L) RNA FISH assays showing circSDHAF2 localization in MES GSCs. Cy3‐labeled circSDHAF2 (red) and DAPI‐stained nuclei (blue) were visualized. (M) Quantification of tumor sphere diameters in GSC20 or GSC267 transfected with sh‐NC or sh‐circSDHAF2. (N) ELDA for GSC20 or GSC267 transfected with sh‐NC or sh‐circSDHAF2. (O) Western blot assays for CD44 and YKL40 protein levels in GSC20 or GSC267 transfected with sh‐NC or sh‐circSDHAF2. (P) Bioluminescent images showing tumor size across groups at indicated time points (n  =  10 per group). (Q) Statistical analysis of bioluminescent tracking data. (R) Kaplan‐Meier survival curves of animals in different groups, n  =  10 per group. Data are presented as the mean ± SD, *P < 0.05, **P < 0.01, *** P < 0.001. Abbreviations: circSDHAF2, circRNA formed by head‐to‐tail splicing of exons of succinate dehydrogenase complex assembly factor 2; GBM, glioblastoma; UMAP, uniform manifold approximation and projection; NR, non‐responder; R, responder; TCGA, The Cancer Genome Atlas; FC, fold change; MES, mesenchymal; PN, pro‐neural; MDM, myeloid‐derived macrophages; RNase R, Ribonuclease R; FISH, fluorescence in situ hybridization; Cy3, cyanine 3; DAPI, 2‐ (4‐Amidinophenyl)‐6‐indolecarbamidine dihydrochloride; ELDA, Extreme Limiting Dilution Analysis; SD, standard deviation.
FIGURE 2
FIGURE 2
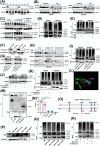
circSDHAF2 stabilized ITGA5 protein to promote MES‐GBM formation. (A) WGCNA module‐trait associations, with columns representing traits and rows representing modules. (B) RNA pull‐down and Western blotting assays revealing the interaction between ITGA5 and circSDHAF2 in GSC20 and GSC267 cells. GAPDH served as a negative control. (C) RIP and qPCR assays showing circSDHAF2 enrichment on anti‐ITGA5, with IgG as a negative control. (D) Predicted secondary structure of circSDHAF2 generated by the RNAfold WebServer, including truncation sites. (E) RNA pull‐down and Western blotting assays identifying ITGA5‐interacting regions on circSDHAF2. (F) Western blotting assays indicating ITGA5 expression changes in GSC20 and GSC267 cells transfected with sh‐NC or sh‐circSDHAF2. (G) Western blotting assays assessing ITGA5 protein levels in GSC20 and GSC267 cells transfected with sh‐NC or sh‐circSDHAF2 and treated with 20 µg/mL CHX over time. (H) Co‐IP assays demonstrating ubiquitination levels of ITGA5 in GSC20 and GSC267 cells transfected with sh‐NC or sh‐circSDHAF2. (I) Monocle2 pseudotime analysis showing a gradual increase in ITGA5 expression with tumor progression. (J) Violin plot showing high ITGA5 expression in the MES‐GBM cells. (K) Correlation between ITGA5 and MES‐GBM cell markers in GBM tissues based on the GEPIA database. (L) Western blotting assays of ITGA5 protein expression in PN (GSC11, GSC8‐11) and MES (GSC20, GSC267) GSC subtypes. (M) Kaplan‐Meier survival curves demonstrating ITGA5 as a prognostic risk factor in GBM based on GEPIA database analysis (P < 0.001). (N) Quantified tumor sphere diameters formed by GSC20 and GSC267 cells transfected with sh‐NC or sh‐ITGA5. (O) ELDA for GSC20 and GSC267 cells transfected with sh‐NC or sh‐ITGA5. (P) Quantified tumor sphere diameters formed by GSC20 and GSC267 cells transfected with the indicated vectors. (Q) ELDA for GSC20 and GSC267 cells transfected with the indicated vectors. (R) Western blotting assays showing CD44 and YKL40 protein levels in GSC20 and GSC267 cells transfected with the indicated vectors. Data are presented as the mean ± SD, *P < 0.05, **P < 0.01, *** P < 0.001. Abbreviations: GBM, glioblastoma; ITGA5, integrin subunit alpha 5; MES, mesenchymal; WGCNA, weighted correlation network analysis; RIP, RNA binding protein immunoprecipitation assay; IgG, Immunoglobulin G; CHX, cycloheximide; Co‐IP, co‐Immunoprecipitation; Ub, ubiquitin; CHI3L1, chitinase 3 like 1; PN, pro‐neural; GEPIA, Gene Expression Profiling Interactive Analysis; ELDA, Extreme Limiting Dilution Analysis; kDa, kilodalton; SD, standard deviation.
FIGURE 3
FIGURE 3
CircSDHAF2 stabilized the ITGA5 protein by facilitating B4GALT1‐mediated N‐glycosylation. (A) Western blotting assays of ITGA5 expression in GSC20 and GSC267 cells treated with varying doses of TM (10 ug/mL). (B) CHX‐chase analysis of GSC20 and GSC267 cells treated with Vehicle or TM (10 ug/mL). Cells were exposed to 20 µmol/L CHX at different intervals, and ITGA5 levels were analyzed by Western blotting. (C) Western blotting assays showing ITGA5 expression in GSC20 and GSC267 cells transfected with ov‐NC or ov‐circSDHAF2, with or without TM, and treated with 20 µg/mL CHX for specified time points. (D) Co‐IP assays detecting ITGA5 ubiquitination in GSC20 and GSC267 cells treated with 10 µg/mL Vehicle or TM. (E) Co‐IP assays assessing ITGA5 ubiquitination in GSC20 and GSC267 cells transfected with ov‐NC or ov‐circSDHAF2, with or without TM. (F) Co‐IP and Western blotting assays showing B4GALT1 interaction with ITGA5. (G) Western blotting assays of ITGA5 expression in GSC20 and GSC267 cells transfected with sh‐NC or sh‐B4GALT1. (H) Western blotting assays measuring ITGA5 expression in GSCs transfected with sh‐NC or sh‐B4GALT1 and treated with 20 µg/mL CHX for defined intervals. (I) Co‐IP assays showing ITGA5 ubiquitination in GSC20 and GSC267 cells transfected with sh‐NC or sh‐B4GALT1. (J) Western blotting assays of ITGA5 expression in GSC20 and GSC267 cells transfected with the indicated vectors. (K) Co‐IP and Western blotting assays analyzing ITGA5 ubiquitination in GSC20 and GSC267 cells transfected with the indicated vectors. (L) PyMOL tool prediction of ITGA5 regions interacting with B4GALT1. (M) Co‐IP and Western blotting assays identifying B4GALT1 interactions with ITGA5 regions in 293T cells transfected with Flag‐tagged FL or truncated mutants (1‐311aa, 321‐504aa, 506‐955aa). (N) RIP and qPCR assays showing the 1‐311aa region of ITGA5 as the binding site for circSDHAF2. (O) Schematic diagram of ITGA5 indicating glycosylation sites. (P) Western blotting showing the ITGA5 N‐glycosylation in 293T cells transfected with Flag‐tagged wild‐type or glycosylation site mutants (MUT‐N84, MUT‐N182, MUT‐N297, MUT‐N307) of ITGA5 vectors. (Q) Western blotting assays examining ITGA5 ubiquitination in 293T cells transfected with Flag‐tagged wild‐type or mutant (MUT‐N84, MUT‐N182, MUT‐N297, MUT‐N307) of ITGA5 vectors. (R) Western blotting assays evaluating ITGA5 ubiquitination in 293T cells transfected with Flag‐tagged wild‐type or 2NQ mutants (MUT‐N84, MUT‐N297) of ITGA5 vectors, along with ov‐NC or ov‐B4GALT1 vectors. Data were presented as the mean ± SD, * P < 0.05, ** P < 0.01, *** P < 0.001. Abbreviations: GBM, glioblastoma; ITGA5, integrin subunit alpha 5; MES, mesenchymal; B4GALT1, Beta‐1,4‐Galactosyltransferase 1; TM, tunicamycin; CHX, Cycloheximide; GSC, glioma stem cells; Ub, ubiquitin; Co‐IP, co‐Immunoprecipitation; FL, full length; aa, amino acid; RIP, RNA binding protein immunoprecipitation assay; IgG, Immunoglobulin G; Asn (N), asparagine; Gln (Q), Glutamine; SD, standard deviation; kDa, kilodalton.
FIGURE 4
FIGURE 4
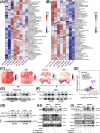
circSDHAF2 promoted ITGA5 translocation into exosomes by facilitating B4GALT1‐mediated N‐glycosylation. (A) Heatmap showing pathway activity differences scored per cell by GSVA across malignant subpopulations. (B) Heatmap displaying pathway activity differences scored per cell by GSVA across MDM subpopulations. (C) Spatial feature plots illustrating hypoxia and EMT signature scores in GBM tissues treated with anti‐PD‐1. (D) Dot plot correlating Log2 FC of protein expression in exosomes with that in GSCs, showing a positive trend. (E) Western blotting assays of ITGA5 expression in GSC exosomes following hypoxia treatment for 0, 24, and 48 h. (F) Western blotting assays of ITGA5 expression in GSC20 and GSC267 cells exposed to hypoxia for 0, 24, and 48 h. (G) Co‐IP and Western blotting assays showing interactions between B4GALT1 and ITGA5 in GSCs under hypoxia treatment for 0, 24, and 48 h. (H) Western blotting assays analyzing ITGA5 expression in GSC20 and GSC267 cells exosomes transfected with sh‐NC or sh‐circSDHAF2. (I) Western blotting evaluating ITGA5 expression in GSC exosomes transfected with the indicated vectors. Abbreviations: ITGA5, integrin subunit alpha 5; B4GALT1, Beta‐1,4‐Galactosyltransferase 1; GSVA, gene set enrichment analysis; GSC, glioma stem cells; EMT, epithelial mesenchymal transition; GBM, glioblastoma; FC, fold change; Exo, exosome; Co‐IP, co‐Immunoprecipitation; R, responder; NR, non‐responder; ES, enrichment score; IgG, Immunoglobulin G.
FIGURE 5
FIGURE 5
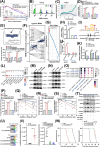
Exosomal ITGA5 protein derived from MES‐GBM promoted SPP1+ MDM polarization. (A) GSEA showing significant enrichment of macrophage chemotaxis pathways in non‐responders compared to responders. (B) Violin plot indicating high CCL2 expression in the MES‐GBM subpopulation. (C) Monocle2 pseudotime analysis revealing a gradual upregulation of CCL2 expression with tumor progression. (D) qPCR assays measuring CCL2 expression in cells transfected with the indicated vectors. (E) Transwell assays evaluating the migration of human THP1‐differentiated macrophages exposed to CM from GSCs transfected with the indicated vectors. The quantification histogram shows relative cell numbers (n  =  3). (F) Volcano plot of differential genes (dark blue: P adj < 0.01, log2(FC) > 0.5) between hypoxic MDM and monocytes, with P adj calculated using Bonferroni correction. (G) Rank plots showing enriched TFs in hypoxic MDM subtypes. (H) qPCR assays measuring SPP1 mRNA expression in cells transfected with sh‐NC or sh‐RUNX1. (I) Predicted RUNX1‐binding sites in the SPP1 promoter region. (J) ChIP‐qPCR assays showing anti‐RUNX1 enrichment at the SPP1 promoter. (K) Luciferase activity of the SPP1 promoter after transfection with si‐NC or si‐RUNX1. (L) Bubble plot indicating high RUNX1 and SPP1 expression in the hypoxic MDM subpopulation. (M) Western blotting assays showing FAK, P‐FAK, RUNX1, and SPP1 levels in THP1‐differentiated macrophages treated with exosomes from GSCs transfected with sh‐NC or sh‐ITGA5. (N) Western blotting assays evaluating FAK, P‐FAK, RUNX1, and SPP1 levels in THP1‐differentiated macrophages treated with exosomes from GSC20 and GSC267 cells transfected with ov‐NC, ov‐ITGA5, or anti‐ITGA5. (O) Selected SPP1 pathway ligand‐receptor pairs mediating signaling between hypoxic MDM and MES‐GBM cells in R and NR groups. Diamond size and color represent communication probability and p‐values, computed using a one‐sided permutation test. (P) Quantitative analysis of tumor sphere diameters formed by GSCs transfected with ov‐NC or ov‐ITGA5, treated with anti‐ITGA5 or anti‐SPP1, and co‐cultured with THP1‐differentiated macrophages. (Q) ELDA for GSCs transfected with ov‐NC or ov‐ITGA5, treated with anti‐ITGA5 or anti‐SPP1, and co‐cultured with THP1‐differentiated macrophages. (R) Quantitative analysis of tumor sphere diameters formed by GSC20 cells treated with anti‐ITGA5 or anti‐SPP1 and co‐cultured with THP1‐differentiated macrophages. (S) ELDA for GSC20 cells treated with anti‐ITGA5 or anti‐SPP1 and co‐cultured with THP1‐differentiated macrophages. (T) Western blotting assays showing STAT3, P‐STAT3, CD44, and YKL40 expression in GSCs treated with anti‐ ITGA5 or anti‐SPP1 and co‐cultured with THP1‐differentiated macrophages. (U) Bioluminescent imaging of tumor size in mice implanted orthotopically with luciferase‐labeled GSC267 and THP1‐differentiated macrophages transfected with the indicated vectors (n  =  10 per group). (V) Statistical analysis of bioluminescent tracking plots. (W) Kaplan‐Meier survival curves of different animal groups (n  =  10 per group). Data are presented as the mean ± SD, * P < 0.05, ** P < 0.01, *** P < 0.001. Abbreviations: GBM, glioblastoma; MES, mesenchymal; FAK, focal adhesion kinase; RUNX1, runt‐related transcription factor‐1; GSEA, gene set enrichment analysis; NES, normalized enrichment score; NPC, neural progenitor‐like; OPC, oligodendrocyte‐like; AC, astrocyte‐like; NR, non‐responder; R, responder; CCL2, C‐C motif chemokine ligand 2; GSC, glioma stem cells; CM, conditioned medium; MDM, myeloid‐derived macrophages; P adj, adjusted p‐value; qPCR, quantitative real‐time polymerase chain reaction; TF, transcription factor; ChIP‐qPCR, chip‐quantitative polymerase chain reaction; ITGA5, integrin subunit alpha 5; SPP1, secreted phosphoprotein 1; ELDA, Extreme Limiting Dilution Analysis; Prob, probability; SD, standard deviation; kDa, kilodalton.
FIGURE 6
FIGURE 6
SPP1+ MDMs promoted GBM immune escape through SPP1‐induced T cell dysfunction. (A) Selected SPP1 pathway ligand‐receptor pairs that contribute to the signaling sending between hypoxic MDM and T cells in non‐responders and responders. The diamond size and color represent the communication probability and P values respectively. The P values are computed from one‐sided permutation test. (B) T cell proliferation, and (C) relative expression of PD‐1, IFN‐γ and TOX on T cells treated with CM collected from THP1‐differentiated macrophages as indicated. (D) Kaplan‐Meier survival analysis for four subgroups of TCGA‐GBM patients stratified by SPP1 and ITGA5 expression. (E) Spatial feature plots of SPP1 and ITGA5 in GBM tissues received anti‐PD‐1 treatment. (F) Left, bioluminescent images showing tumor size across groups on Day 14 (n  =  10 per group). Right, statistical analysis of bioluminescent tracking plots. (G) Kaplan‐Meier survival curves for animals in different groups, n  =  10 for each group. (H) A schematic diagram showing mechanistic summary of resistance to anti‐PD‐1 immunotherapy in GBM. All data are presented as the means ± SD, **p < 0.01, ***p < 0.001. * P < 0.05, ** P < 0.01, *** P < 0.001. Abbreviations: MDM, myeloid‐derived macrophages; GBM, glioblastoma; NR, non‐responder; R, responder; CM, conditioned medium; ITGA5, integrin subunit alpha 5; MES, mesenchymal; anti‐ITGA5, blocking ITGA5 antibodies; anti‐SPP1, blocking SPP1 antibodies; SD, standard deviation.

References

    1. McKinnon C, Nandhabalan M, Murray SA, Plaha P. Glioblastoma: clinical presentation, diagnosis, and management. BMJ. 2021;374:n1560. - PubMed
    1. Tomaszewski W, Sanchez‐Perez L, Gajewski TF, Sampson JH. Brain Tumor Microenvironment and Host State: Implications for Immunotherapy. Clin Cancer Res. 2019;25(14):4202‐10. - PMC - PubMed
    1. Puchalski RB, Shah N, Miller J, Dalley R, Nomura SR, Yoon JG, et al. An anatomic transcriptional atlas of human glioblastoma. Science. 2018;360(6389):660‐3. - PMC - PubMed
    1. Lan X, Jörg DJ, Cavalli FMG, Richards LM, Nguyen LV, Vanner RJ, et al. Fate mapping of human glioblastoma reveals an invariant stem cell hierarchy. Nature. 2017;549(7671):227‐32. - PMC - PubMed
    1. Aldape K, Brindle KM, Chesler L, Chopra R, Gajjar A, Gilbert MR, et al. Challenges to curing primary brain tumours. Nat Rev Clin Oncol. 2019;16(8):509‐20. - PMC - PubMed

MeSH terms