. 2025 Apr 2;13(4):527-546.
doi: 10.1158/2326-6066.CIR-24-0151.

CD103+CD56+ ILCs Are Associated with an Altered CD8+ T-cell Profile within the Tumor Microenvironment

Affiliations

CD103+CD56+ ILCs Are Associated with an Altered CD8+ T-cell Profile within the Tumor Microenvironment

Douglas C Chung et al. Cancer Immunol Res. .

Abstract

Immunotherapies have had unprecedented success in the treatment of multiple cancer types, albeit with variable response rates. Unraveling the complex network of immune cells within the tumor microenvironment (TME) may provide additional insights to enhance antitumor immunity and improve clinical response. Many studies have shown that NK cells or innate lymphoid cells (ILC) have regulatory capacity. Here, we identified CD103 as a marker that was found on CD56+ cells that were associated with a poor proliferative capacity of tumor-infiltrating lymphocytes in culture. We further demonstrated that CD103+CD56+ ILCs isolated directly from tumors represented a distinct ILC population that expressed unique surface markers (such as CD49a and CD101), transcription factor networks, and transcriptomic profiles compared with CD103-CD56+ NK cells. Using single-cell multiomic and spatial approaches, we found that these CD103+CD56+ ILCs were associated with CD8+ T cells with reduced expression of granzyme B. Thus, this study identifies a population of CD103+CD56+ ILCs with potentially inhibitory functions that are associated with a TME that includes CD8+ T cells with poor antitumor activity. Further studies focusing on these cells may provide additional insights into the biology of an inhibitory TME.


Conflict of interest statement

H.W. Jackson reports grants, personal fees, and nonfinancial support from Standard BioTools, personal fees and nonfinancial support from Abcam, and nonfinancial support from Somalogic outside the submitted work. P.S Ohashi reports grants from Canadian Institutes of Health Research, Canadian Cancer Society, TRANSCAN3, and Princess Margaret Cancer Foundation Wolfond Immunotherapy Fund during the conduct of the study, as well as other support from Providence Therapeutics, Treadwell Therapeutics, Tikvo Allocell, and Rondo Therapeutics outside the submitted work. S.Q. Crome, P.S. Ohashi, and L.T. Nguyen filed a patent serial no. 16/325,923. No disclosures were reported by the other authors.

Figures
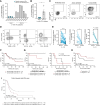
Figure 1.
Figure 1.
CD103 may define a population of CD56+Lin cells with immunoregulatory function. A and B, TILs were cultured in vitro in high-dose IL-2 (6,000 IU/mL) for 4 weeks. The proportion of CD56+ ILCs expressing CD103 is shown in TIL cultures that were slow- or non-expanding (<4 × 10⁶ cells) compared with rapidly expanding TIL cultures (≥4 × 10⁶ cells). A two-tailed Student t test was used, and variance is shown as SEM (B). C, Representative contour plots of CD103 in CD56+Lin (CD3TCRαβTCRγδCD14CD19CD20CD34CD123CD303FcεRIα) ILCs from healthy donor peripheral blood (PB) samples, ascites, and tumors. Expression of markers associated with cytolysis (i.e., GZMB, CD107a, and CD16) in CD103+CD56+Lin ILCs and CD103CD56+Lin ILCs were analyzed by flow cytometry and representative samples shown as contour plots (D) and pairwise comparisons using a two-tailed Student t test (E). Kaplan–Meier curves showing differences in RFS between patients with EOC stratified based on characteristics within the TME (F–H). F, CD103+CD56+Lin ILC High tumors had ≥60% of CD56+ ILCs expressing CD103, and CD103+CD56+Lin ILC Low had ≤40% of CD56+Lin ILCs expressing CD103. G, Patients were stratified into four groups based on CD103 expression on CD56+Lin ILCs and CD8+ T cells, including (i) ILC high / CD8 high (left), (ii) ILC low / CD8 high (left), (iii) ILC high / CD8 low (right), and (iv) ILC low / CD8 low (right). ILC high–designated and low–designated tumors expressed CD103 in the top or bottom 50th percentile, respectively. CD8 T cell high and low were designated similarly. H, Patients were stratified based on whether they were in the top (Treg high) or bottom (Treg low) 50th percentile in their proportions of PD1intICOShiCD4+ Tregs. P values and HRs were calculated using the log-rank and Mantel–Haenszel tests, respectively. I, CD56+ immunoregulatory gene signature was developed from Crome and colleagues (Ref. ; 2017) and applied to bulk RNA-seq datasets curated from GSE9891, GSE17260, GSE26193, GSE30161, GSE49997, and TCGAOVARIAN. Survival analysis of patients with ovarian carcinoma was conducted using RFS, and survival curve groups were determined by high (n = 140) or low (n = 112) expression of the CD56+ immunoregulatory gene signature. A random effect model was used when combining estimators (D index). *, P < 0.05; ****, P < 0.0001. FSC, forward scatter.
Figure 2.
Figure 2.
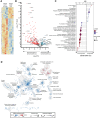
CD103+CD56+Lin ILCs exhibit a distinct transcriptomic profile from CD103CD56+Lin NK cells. RNA was extracted and sequenced from FACS-sorted CD103+CD56+Lin ILCs and CD103CD56+Lin ILCs from four primary high-grade serous tumors (OV225, OV332, OV738, and OV744; A–D). A, Heatmap of CD56+Lin ILC subsets with z-score of all differentially expressed genes. B, Volcano plot showing gene expression differences, summarized as log2 (FC) by log10P value, between CD103+CD56+Lin ILCs vs. CD103CD56+Lin ILCs. C, Normalized enrichment score (NES), FDR-adjusted P values, and gene counts are displayed for select gene sets that are upregulated or downregulated in CD103+CD56+Lin ILCs compared with CD103CD56+Lin ILCs. D, Network clustering analysis using shared genes from gene sets significantly enriched in gene set enrichment analysis (GSEA) analysis of CD103+CD56+Lin ILCs compared with CD103CD56+Lin ILCs. Gene sets with FDR-adjusted P values of ≤0.15 were included. All gene set clusters with at least five gene sets are displayed in terms of NES, gene set size, and similarity coefficient (measuring gene overlap between two gene sets). ECM, extracellular matrix; EFP, estrogen-responsive finger protein; ER, endoplasmic reticulum; MMP, matrix metalloproteinase; MPR, mannose phosphate receptor; PDGFRβ, platelet-derived growth factor receptor beta; ROS, reactive oxygen species; TPO, thrombopoietin.
Figure 3.
Figure 3.
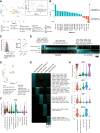
CD103+CD56+Lin ILCs express CD101 and are phenotypically distinct from other CD56+ ILC subsets. A, Heatmap from bulk RNA-seq of FACS-sorted intratumoral CD103+CD56+Lin ILCs (n = 4) and CD103CD56+Lin ILCs (n = 4) showing gene expression of immune molecules. Bolded text indicates markers previously associated with ILCs or that are inhibitory immune molecules. B, Flow cytometry staining of intratumoral CD56+Lin ILCs. Representative histograms showing surface expression of different markers between CD103+CD56+Lin ILCs and CD103CD56+Lin NK cells. C, Summary dot plots of (B) with pairwise comparisons using a Student t test. D, Contour plots of CD56+Lin ILCs from peripheral blood (PB) of healthy donor, ascites, or tumor showing CD101 and CD103 expression. E, Summary dot plot of (D) with a paired Student t test. F (left), Contour plot gated on CD56+Lin ILC subsets including CD49a+CD103 NK cells, CD56brightCD16 NK cells, and CD56dimCD16+/− NK cells. Representative data from n = 3 tumors are shown. F (right), Histograms showing expression of various surface markers on CD103+CD49a+CD56+Lin ILCs compared with different NK cell subsets. G, Summary bar plots of (F). *, P < 0.05; **, P < 0.01; ****, P < 0.0001. FMO, fluorescence minus one; MFI, mean fluorescence intensity.
Figure 4.
Figure 4.
scRNA-seq reveals distinct transcriptional regulons and gene programs in intratumoral CD103+CD56+ ILCs. scRNA-seq was performed on FACS-sorted CD45+ immune cells and CD45 non-immune cells mixed in 1:1 ratio from three primary high-grade serous tumors (OV348, OV744, and OV749). A total of 15,742 cells successfully passed quality control and were included in this analysis. A, UMAP color coded by population, with CD56+ ILCs highlighted (right) and reanalyzed with unsupervised clustering into two subsets: CD103+CD56+ ILCs (n = 90) and CD103CD56+ ILCs (n = 334). CD56+ ILCs with new subclusters were pooled back into original UMAP for comparisons across other immune cell types (right). B, SCENIC was performed to infer TF networks that are upregulated in CD103+CD56+ ILCs compared with CD103CD56+ ILCs. Regulons that had an adjusted P value <0.01 are shown. Numerical values in brackets indicate the number of genes associated with each regulon. Regulons labeled in blue have previously been shown to have roles in Treg development, differentiation, and suppressive functions. C, Histogram (left) and summary dot plot with a paired Student t test (right) of IRF4 staining by flow cytometry. D, Heatmap comparing Treg DEGs or γδ T-cell DEGs by log2 (FC) that reached adjusted P value <0.01 in different populations of cells (i.e., CD103+CD56+ ILCs, Tregs, CD103CD56+ ILCs, and γδ T cells). Cellular indexing of transcriptomes and epitopes sequencing (CITE-seq) of intratumoral CD56+CD127+/−Lin (CD3TCRαβTCRγδCD14CD19CD20CD34CD123CD303FcεRIα) ILCs and CD56CD127+Lin ILCs mixed in a 1:1 ratio from primary ovarian tumors (E–H). E, UMAP of unsupervised clustering resulting in five ILC subsets (c0, c1, c3, c5, and c6). F, Protein expression of CD56 across all cells and CD103 across all ILC subsets. G, Heatmap of genes differentially expressed within each ILC cluster showing log2 (FC). H, Violin plots of protein expression CD103 or gene expression of KLRC1, IKZF3, and ZNF683. *, P < 0.05. DEG, differentially expressed genes; FC, fold change; FMO, fluorescence minus one; MFI, mean fluorescence intensity.
Figure 5.
Figure 5.
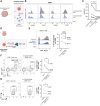
Intratumoral CD103+CD56+Lin ILCs alter autologous CD8+ T-cell phenotypes. A, Schematic diagram of coculture assays in which intratumoral CD45+ TILs were FACS sorted from four patients with HGSC (OV225, OV331, OV767, and OV806) and cocultured with autologous intratumoral CD103+CD56+Lin (CD3CD14CD19) ILCs at a 1:3 or 1:5 ratio (suppressor : responders) with soluble αCD3 monoclonal antibodies for 4 days. CD8+ TILs in conditions with or without intratumoral CD103+CD56+Lin ILCs were measured for expression of GZMB (B and C). These assays have two to seven technical replicates, and samples were conducted over two separate experiments (i.e., left to right: OV225, OV331, and OV806; OV767; B). D, Schematic diagram of coculture assays in which intratumoral CD8+ T cells were FACS sorted from four patients with HGSC (OV411, OV687, OV745, and OV857) and cocultured with autologous intratumoral CD103+CD49a+CD56+Lin ILCs with αCD3/αCD28 monoclonal antibodies for 4 days. OV411, OV745, and OV857 were cultured at a 1:1 ratio (suppressor : responder) with 15,000 T cells, whereas OV687 was cultured in a 1:13 ratio with 10,000 T cells. To provide additional support to increase survival of CD8+ T cells in culture, IL-2 (100 IU; i.e., OV745, OV411, and OV687) or CD25CD4+ T cells (i.e., OV857) were added to the cultures. E, Expression of CD25 in CD8+ T cells with or without coculture of CD103+CD49a+CD56+Lin ILCs are shown as histograms (left) or pairwise comparisons (right). Proportion of GZMB+CD25+ CD8+ T cells (F) or Ki67+CD8+ T cells (G) are shown as contour plots (left) or pairwise comparisons (right). Ki67+, GZMB+ KI67+, or GZMB+CD25+ CD8+ T cells from co-cultures are shown as contour plots (F) or pairwise comparisons (G). C and E–G, Pairwise two-tailed Student t tests were used as statistical tests and lines corresponding to cells from the same patient are shown. *, P < 0.05. CON, FMO staining control; FMO, fluorescence minus one; MFI, mean fluorescence intensity. (Schematics in A and D were created with BioRender.com.)
Figure 6.
Figure 6.
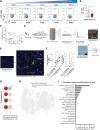
CD103+CD56+Lin ILCs are associated with CD8+ T cells that express lower levels of GZMB within the TME. To evaluate the phenotype associated with CD103+CD56+ ILCs, flow cytometry was used to characterize CD8+ T cells with varying proportions of CD103+CD56+Lin ILCs (A–C). Intracellular expression of GZMB is shown on CD8 cells (A), with five different tumor fragments from patients with HGSC displayed with increasing proportions of CD103+CD56+Lin ILCs (from left to right). B, T-cell profiles from patients that have a high abundance of CD103+CD56+Lin ILCs (>75%, n = 5) or low abundance of CD103+CD56+Lin ILCs (<25%, n = 4). An unpaired two-tailed Student t test was performed. C, Linear regression of intratumoral T-cell expression of GZMB is shown with proportion of CD103+CD56+Lin ILCs within the TME (n = 12). D, IMC was performed on eight HGSC tumors to identify cells that were physically interacting with CD103+NKp46+Lin ILCs in situ. E, Representative image of CD103+Nkp46+Lin (PanCK-SMA-Vim-CD3CD20CD14CD15CD16CD123CD127CD117) cells (labeled in purple) interacting with GZMB-CD8+ T cells (labeled in green). F, The percentage of CD8+ T cells expressing GZMB or Ki-67 that were either (i) touching CD103+NKp46+Lin ILCs or (ii) not touching CD103+NKp46+Lin ILCs are shown on dot plots. Lines show paired tumor samples. To determine other cell types that interacted with CD103+NKp46+Lin ILCs (G), we isolated these contacting cells in silico and identified the cell type classification (H). I, From the total of cells in contact with CD103+Nkp46+Lin ILCs, the total proportion of these cells that belonged to each cell cluster is shown in a bar graph. Cells from undefined cell clusters were not shown and excluded from analysis. *, P < 0.05; **, P < 0.01; variance displayed as SEM. CyTOF, cytometry time-of-flight; FSC, forward scatter. (Schematics in D and G were created with BioRender.com.)
Figure 7.
Figure 7.
CD103+CD56+Lin ILCs are associated with CD8+ T cells with a reduced activated transcriptomic signature. A, scRNA-seq was performed on FACS-sorted CD45+ immune cells with removal of CD56+Lin ILCs from six primary ovarian tumors and unsupervised clustering resulted in 17 clusters. B, CD8+ T cells from tumors with high proportions of CD103+CD56+ ILCs (i.e., OV710 and OV348) were compared with CD8+ T cells from tumors with low proportions of CD103+CD56+ ILCs (i.e., OV702, OV744, and OV749) and DEG analysis was performed. C, All genes that were differentially expressed and met the cutoff of Padjusted < 0.01 and log2 FC > 0.25 that belonged to the KEGG T-cell receptor signaling pathway and the BiocartaTCR pathway are shown as a heatmap of log2 FC for each CD8+ T cell clusters (c1, c2, and c9). To develop a T-cell activation gene signature, we performed scRNA-seq of CD8+ T cells from peripheral blood mononuclear cells of healthy donors activated with αCD3/αCD28 for 18 hours. D (left), Total number of T-cell activation genes that were upregulated or downregulated in intratumoral CD8+ T cells from (A) and (B) in CD103+CD56+ ILC–high tumors compared with CD103+CD56+ ILC–low tumors. D (right), Dot plot in which each dot represents genes within the T-cell activation gene signature that were differentially expressed between CD8+ T cells from CD103+CD56+ ILC–high tumors compared with CD103+CD56+ ILC–low tumors and reached significance thresholds (Padjusted < 0.01 and log2 FC > 0.25). E and F, Schematics showing that CD103+CD56+ ILCs are associated with an altered CD8+ T-cell profile. DEG, differentially expressed genes; FC, fold change; KEGG, Kyoto Encyclopedia of Genes and Genomes; No., number. (Schematics in B, E, and F were created with BioRender.com.)

References

    1. Vivier E, Artis D, Colonna M, Diefenbach A, Di Santo JP, Eberl G, et al. . Innate lymphoid cells: 10 years on. Cell 2018;174:1054–66. - PubMed
    1. Bernink JH, Krabbendam L, Germar K, de Jong E, Gronke K, Kofoed-Nielsen M, et al. . Interleukin-12 and -23 control plasticity of CD127+ group 1 and group 3 innate lymphoid cells in the intestinal lamina propria. Immunity 2015;43:146–60. - PubMed
    1. Vonarbourg C, Mortha A, Bui VL, Hernandez PP, Kiss EA, Hoyler T, et al. . Regulated expression of nuclear receptor RORγt confers distinct functional fates to NK cell receptor-expressing RORγt+ innate lymphocytes. Immunity 2010;33:736–51. - PMC - PubMed
    1. Crinier A, Kerdiles Y, Vienne M, Cózar B, Vivier E, Berruyer C. Multidimensional molecular controls defining NK/ILC1 identity in cancers. Semin Immunol 2021;52:101424. - PubMed
    1. Sojka DK, Plougastel-Douglas B, Yang L, Pak-Wittel MA, Artyomov MN, Ivanova Y, et al. . Tissue-resident natural killer (NK) cells are cell lineages distinct from thymic and conventional splenic NK cells. Elife 2014;3:e01659. - PMC - PubMed

MeSH terms