. 2025 Mar 14;10(105):eadn8715.
doi: 10.1126/sciimmunol.adn8715. Epub 2025 Mar 14.

QRICH1 mediates an intracellular checkpoint for CD8+ T cell activation via the CARD11 signalosome

Affiliations

QRICH1 mediates an intracellular checkpoint for CD8+ T cell activation via the CARD11 signalosome

Nicole M Carter et al. Sci Immunol. .

Abstract

Antigen receptor signaling pathways that control lymphocyte activation depend on signaling hubs and negative regulatory proteins to fine-tune signaling outputs to ensure host defense and avoid pathogenic responses. Caspase recruitment domain-containing protein 11 (CARD11) is a critical signaling scaffold that translates T cell receptor (TCR) triggering into the activation of nuclear factor κB (NF-κB), c-Jun N-terminal kinase (JNK), mechanistic target of rapamycin (mTOR), and Akt. Here, we identify glutamine-rich protein 1 (QRICH1) as a regulator of CARD11 signaling that mediates an intracellular checkpoint for CD8+ T cell activation. QRICH1 associates with CARD11 after TCR engagement and negatively regulates CARD11 signaling to NF-κB. QRICH1 binding to CARD11 is controlled by an autoregulatory intramolecular interaction between QRICH1 domains of previously uncharacterized function. QRICH1 controls the antigen-induced activation, proliferation, and effector status of CD8+ T cells by regulating numerous genes critical for CD8+ T cell function. Our results define a component of antigen receptor signaling circuitry that fine-tunes effector output in response to antigen recognition.


Conflict of interest statement

Competing interests: The authors declare that they have no competing interests.

Figures

Fig. 1.
Fig. 1.. QRICH1 binds activated CARD11 and inhibits signaling to NF-κB.
(A) Protein immunoblot for QRICH1 in Jurkat T cells infected with the indicated CRISPR gRNAs targeting QRICH1 (sgRNAs A and B) or NT. (B) Luciferase dual-reporter assay for NF-κB activation in QRICH1-deficient or control Jurkat T cell populations after stimulation with the indicated concentration of anti-CD3/CD28. (C) Luciferase dual-reporter assay for NF-κB activation in QRICH1-deficient or control Jurkat T cell populations cotransfected with the indicated amount of CRISPR-resistant mouse QRICH1 cDNA and stimulated with anti-CD3/CD28 (0.1 μg/ml). (D) GFP expression in QRICH1-deficient or control GFP NF-κB reporter Jurkat T cell populations after stimulation with anti-CD3/CD28 (0.1 μg/ml). (E) Luciferase dual-reporter assay for NF-κB activation in WT Jurkat T cells transfected with the indicated amount of QRICH1 cDNA and stimulated with anti-CD3/CD28 (0.5 μg/ml). (F) ELISA for IL-2 production by QRICH1-deficient or control Jurkat T cell populations after stimulation with anti-CD3/CD28 (5 μg/ml). (G) Coimmunoprecipitation of endogenous QRICH1 and the indicated proteins from WT Jurkat T cells after stimulation for the indicated times with PMA and ionomycin. (H) Coimmunoprecipitation of QRICH1 and the indicated CARD11 constructs upon coexpression in HEK293T cells. IP, immunoprecipitation; WB, Western blot. (I) Subcellular fractionation depicting the localization of endogenous QRICH1 in WT Jurkat T cells before and after stimulation with PMA and ionomycin. Cyt., cytoplasmic; Nuc., nuclear; Chrom., chromatin-bound; Mem., membrane. (J to L) Top: Luciferase dual-reporter assay for NF-κB activation in HEK293T cells cotransfected with CARD11ΔID (J), CARD11-L251P (K), or CARD11-C49y (L) and the indicated amount of QRICh1 cDNA. Bottom: Protein immunoblots depicting the expression of QRICH1 and CARD11 constructs in the reporter assay lysates. Data in (B), (C), (E), (F), and (J) to (L) are presented as means ± SEM with individual data points shown; n = 3 technical replicates per condition. **P < 0.01, ***P < 0.001, and ****P < 0.0001; unpaired two-tailed t test [(B) and (F)] or one-way analysis of variance (ANOVA) with Dunnett’s multiple comparisons test [(C), (E), and (J) to (L)]. All data are representative of two or three independent experiments. n.s., not significant.
Fig. 2.
Fig. 2.. The C-terminal DUF3504 domain in QRICH1 is an autoregulatory domain.
(A) Diagram of conserved domains in QRICH1 (according to the National Center for Biotechnology Information Conserved Domain Database). Mouse homologs of point mutations identified in patients with Ververi-Brady syndrome are indicated. (B) Left: luciferase dual-reporter assay for NF-κB activation in HEK293T cells cotransfected with CARD11ΔID and the indicated QRICH1 constructs. Right: protein immunoblot depicting expression of the QRICH1 constructs in reporter assay lysates. (C) Left: luciferase dual-reporter assay for NF-κB activation in WT Jurkat T cells transfected with the indicated amount of full-length QRICH1 or QRICH1-Δ601–777 and stimulated with anti-CD3/CD28 (0.5μg/ml). Right: protein immunoblot showing expression of full-length QRICH1 and QRICH1-Δ601777 at the indicated DNA amounts. (D) Coimmunoprecipitation of the indicated QRICH1 constructs and CARD11ΔID upon coexpression in HEK293T cells. (E) Coimmunoprecipitation of QRICH1-aa601–777 and QRICH1-Δ601–777 upon coexpression in HEK293T cells. (F) Left: luciferase dual-reporter assay for NF-κB activation by CARD11ΔID in HEK293T cells cotransfected with the indicated QRICH1 constructs at DNA amounts yielding protein expression equivalent to WT QRICH1. Right: protein immunoblots depicting QRICH1 expression in reporter assay lysates. Data in (B), (C), and (F) are depicted as means ± SEM with individual data points shown; n = 3 technical replicates per condition. **P < 0.01, ***P < 0.001, and ****P < 0.0001; one-way ANOVA with Tukey’s test for multiple comparisons (B), two-way ANOVA with Tukey’s test for multiple comparisons (C), or one-way ANOVA with Dunnett’s test for multiple comparisons (F); only relevant comparisons are shown. In (F), blue asterisks compare DNA yielding protein expression equivalent to 25 ng of WT QRICH1; red asterisks compare DNA yielding protein expression equivalent to 75 ng of WT QRICH1; orange asterisks compare DNA yielding protein expression equivalent to 150 ng of WT QRICH1. [(B) to (E)] are representative of three independent experiments, and (F) is representative of two independent experiments.
Fig. 3.
Fig. 3.. Primary QRICH1-KO CD8+ T cells display increased cytokine production and proliferation downstream of TCR costimulation.
(A) Design of QRICH1 conditional KO mouse. Exon 3 of the murine QRICH1 gene, containing the first coding exon, is flanked by loxP sites. (B) ELISA for IFN-γ production by QRICH1-KO or control mouse primary CD8+ T cells after 24 hours of stimulation with the indicated dose of anti-CD3/CD28 beads. (C) ELISA for IL-2 production by QRICH1-KO or control mouse primary CD4+ T cells after 24 hours of stimulation with the indicated dose of anti-CD3/CD28 beads. (D) Representative intracellular staining for IFN-γ and TNF-α in QRICH1-KO or control mouse primary CD8+ T cells, after 24 hours of stimulation with anti-CD3/CD28 (1:1 cell:bead ratio), gated on live CD8+ single cells. PE, phycoerythrin; APC, allophycocyanin. (E) Quantification of IFN-γ+, TNF-α+, and TNF-α+ IFN-γ+ cells among QRICH1-KO or control mouse primary CD8+ T cells stimulated for 24 hours with the indicated dose of anti-CD3/CD28 beads. (F) Mean fluorescence intensity (MFI) for IFN-γ and TNF-α from QRICH1-KO or control mouse primary CD8+ T cells stimulated for 24 hours with anti-CD3/CD28 (1:1 cell:bead ratio). (G) Representative proliferation of mouse primary CD8+ T cells of the indicated genotypes after 48 hours of stimulation with anti-CD3/CD28 (1:0.25 cell:bead ratio). (H) Quantification of divided mouse primary CD8+ T cells after 48 hours of stimulation with anti-CD3/CD28 (1:0.25 cell:bead ratio). (I) Protein immunoblot for QRICH1 in WT mouse primary CD8+ or CD4+ T cells after 24 hours of stimulation with the indicated dose of anti-CD3/CD28 beads. Data in (B), (C), (E), (F), and (H) are presented as means ± SEM with individual data points shown; n = 4 technical replicates per condition [(B) and (C)] or n = 3 technical replicates per condition [(E), (F), and (H)]. *P < 0.05, **P < 0.01, and ***P < 0.001; unpaired two-tailed t test. [(B), (C), and (I)] Data are representative of two independent experiments; [(D) to (H)] data are representative of three or more independent experiments.
Fig. 4.
Fig. 4.. Primary QRICH1-KO CD8+ T cells exhibit increased cytokine production and markers of degranulation in response to antigen-specific stimulation.
(A) Representative intracellular staining for IFN-γ and TNF-α in OT-1 CD8+ T cells of the indicated genotypes stimulated for 48 hours with N4 Ova (SIINFEKL) peptide. (B) Quantification of IFN-γ+, TNF-α+, and TNF-α+ IFN-γ+ cell populations and IFN-γ and TNF-α MFIs among OT-1 CD8+ T cells stimulated for the indicated times with N4 Ova peptide. hr, hours. (C) Representative intracellular staining for perforin and granzyme B (GB) in OT-1 CD8+ T cells of the indicated genotypes stimulated for 24 hours with N4 Ova peptide. (D) Quantification of perforin+, GB+, and perforin+ GB+ cell populations and perforin and GB MFIs among OT-1 CD8+ T cells stimulated for the indicated times with N4 Ova peptide. (E) Representative staining for CD107a in OT-1 CD8+ T cells of the indicated genotypes stimulated for 48 hours with N4 Ova peptide. (F) Quantification of CD107a+ cells and CD107a MFI among OT-1 CD8+ T cells stimulated for the indicated times with N4 Ova peptide. (G) Representative intracellular staining for il-2 in ot-1 CD8+ t cells stimulated for 24 hours with N4 Ova peptide. SSC-A, side scatter area; Pe-TR, phycoerythrin–Texas red. (H) Quantification of IL-2+ cells and IL-2 MFI among OT-1 CD8+ T cells stimulated for the indicated times with N4 Ova peptide. (I) Representative staining for IFN-γ and TNF-α in OT-1 CD8+ T cells of the indicated genotypes stimulated for 24 hours with N4 Ova peptide or T4 (SIITFEKL) Ova peptide. (J) Quantification of IFN-γ+, TNF-α+, and TNF-α+ IFN-γ+ cell populations and IFN-γ and TNF-α MFIs among OT-1 CD8+ T cells stimulated for 24 hours with N4 or T4 Ova peptide. Data in (A), (C), (E), (G), and (I) are gated on live CD3+ CD8+ single cells. Data in (B), (D), (F), (H), and (J) are presented as means ± SEM with individual data points shown; n = 3 technical replicates per condition. **P < 0.01, ***P < 0.001, and ****P < 0.0001; unpaired two-tailed t test. all data are representative of two independent experiments.
Fig. 5.
Fig. 5.. QRICH1 affects signaling to the NF-κB, mTOR, JNK2, and ERK pathways in activated CD8+ T cells.
(A) Protein immunoblots for p-IκBα, IκBα, and β-actin in OT-1 CD8+ T cells stimulated for the indicated times with MHC class I N4 Ova tetramer. (B) Quantification of protein immunoblots in (A). (C) Protein immunoblots for p-S6 (S235/236), p-S6 (S240/244), and S6 in OT-1 CD8+ T cells stimulated for the indicated times with MHC class I N4 Ova tetramer. (D) Quantification of protein immunoblots in (C). (E) Protein immunoblots for p-JNK1/2 and JNK2 in OT-1 CD8+ T cells stimulated for the indicated times with PMA and ionomycin. (F) Quantification of protein immunoblots in (E). (G) Protein immunoblots for p-ERK1/2 and ERK1/2 in OT-1 CD8+ T cells stimulated for the indicated times with MHC class I N4 Ova tetramer. (H) Quantification of protein immunoblots in (G). All data are representative of two or more independent experiments.
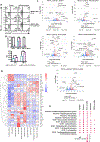
Fig. 6.
Fig. 6.. Bulk RNA-seq unveils broad effects of QRICH1 on expression of immune-related genes in CD8+ T cells.
(A) Representative intracellular staining for IFN-γ and TNF-α in OT-1 CD8+ T cells of the indicated genotypes stimulated for 4 hours with MHC class I N4 Ova tetramer, gated on live CD8+ single cells. (B) Quantification of IFN-γ+, TNF-α+, and TNF-α+ IFN-γ+ cell populations and IFN-γ and TNF-α MFIs among OT-1 CD8+ T cells of the indicated genotypes stimulated for 4 hours with 1 nM MHC class I N4 Ova tetramer. Data are presented as means ± SEM with individual data points shown; n = 3 technical replicates per condition. *P < 0.05 and ****P < 0.0001; unpaired two-tailed t test. Data are representative of two independent experiments. (C) Volcano plots showing significantly up-regulated and significantly down-regulated genes (P adj < 0.05, |log2 fold change| > 1) in QRICH1-fl/fl, OT-1/CD4-Cre (“KO”) CD8+ T cells compared with QRICH1-fl/fl, OT-1/+ (“control”) CD8+ T cells under the indicated stimulation conditions. Selected genes are labeled. (D) Heatmap depicting expression patterns of selected immune-related genes in QRICH1-KO and control OT-1 CD8+ T cells under the indicated stimulation conditions. (E) GSEA scores for selected gene sets relating to T cell function under the indicated stimulation conditions. False discovery rate < 0.25 for all gene sets depicted. GO BP, Gene Ontology Biological Processes; NES, normalized enrichment score.
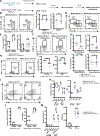
Fig. 7.
Fig. 7.. QRICH1-KO CD8+ T cells display enhanced effector differentiation in response to L. monocytogenes infection.
(A) Design of experiment. QRICH1-KO or control OT-1 CD8+ T cells (CD45.2+) were adoptively transferred into WT CD45.1+ hosts. Four hours later, hosts were infected with LM-Ova. at day 7 postinfection, spleens of infected mice were harvested, and the adoptively transferred OT-1 CD8+ T cell populations were analyzed by flow cytometry. (B and C) Representative staining (B) and pooled quantification (C) of OT-1 donor CD8+ T cells (CD45.2+) in the spleens of infected mice, gated on live CD3+ CD8+ single cells. (D and E) Representative staining (D) and pooled quantification (E) of CD127+ and KLRG1+ OT-1 cells in the spleens of infected mice, gated on live CD3+ CD8+ CD45.2+ single cells. (F and G) Representative staining (F) and pooled quantification (G) of CD44-hi CD62l-hi and CD44-hi CD62L-lo OT-1 cells in the spleens of infected mice, gated on live CD3+ CD8+ CD45.2+ single cells. (H) Representative intracellular staining for TCF1 among OT-1 cells in the spleens of infected mice, gated on live CD3+ CD8+ CD45.2+ single cells. (I) Pooled quantification of TCF1-hi cells and TCF1 MFI among OT-1 cells from the spleens of infected mice. (J) Representative intracellular staining for perforin (Perf) and granzyme B (GB) in OT-1 cells from the spleens of infected mice, after ex vivo restimulation with N4 Ova peptide, gated on live CD3+ CD8+ CD45.2+ single cells. (K) Pooled quantification of perforin+, granzyme B+, and perforin+ granzyme B+ cell populations and perforin and granzyme B MFIs among OT-1 cells from the spleens of infected mice, with and without ex vivo restimulation with N4 Ova peptide. (L) Pooled quantification of CD107a+ cells and CD107a MFI among OT-1 cells from the spleens of infected mice, with and without ex vivo restimulation with N4 Ova peptide, gated on live CD3+ CD8+ CD45.2+ single cells. (M) Pooled quantification of TNF-α+, IFN-γ+, and TNF-α+ IFN-γ+ cells and TNF-α and IFN-γ MFIs among OT-1 cells from the spleens of infected mice, with and without ex vivo restimulation with N4 Ova peptide, gated on live CD3+ CD8+ CD45.2+ single cells. Data in (C), (E), (G), (I), and (K) to (M) are presented as means ± SEM with individual data points shown. *P < 0.05, **P < 0.01, ***P < 0.001, and ****P < 0.0001; unpaired two-tailed t test. Data are representative of two independent experiments, n = 10 to 12 mice per genotype per experiment.
Fig. 8.
Fig. 8.. QRICH1 fine-tunes CARD11 signaling to NF-κB downstream of TCR engagement.
In the absence of TCR engagement, QRICH1 is held in a closed and inactive conformation in the cytoplasm because of an intramolecular interaction between its C-terminal autoinhibitory domain (DUF3504) and its N terminus, and CARD11 is maintained in a closed and inactive conformation due to REs within its ID. Upon TCR engagement, CARD11 undergoes a conformational change to its open and active conformation, leading to activation of the IKK complex, which phosphorylates IκBα, targeting it for ubiquitinylation and proteasomal degradation. IκBα degradation allows for the nuclear translocation of NF-κB, which activates the transcription of target genes involved in processes such as proliferation, cytokine production, and degranulation. teal arrows depict signaling events downstream of CARD11 opening. Recruitment of QRICH1 to activated CARD11 downstream of the opening step inhibits signaling to the IKK complex (dark blue inhibitory arrow), thereby down-regulating downstream events and fine-tuning the CARD11-mediated signaling output of TCR engagement.

References

    1. Gaud G, Lesourne R, Love PE, Regulatory mechanisms in T cell receptor signalling. Nat. Rev. Immunol. 18, 485–497 (2018). - PubMed
    1. Schlicher L, Green LG, Romagnani A, Renner F, Small molecule inhibitors for cancer immunotherapy and associated biomarkers - the current status. Front. Immunol. 14, 1297175 (2023). - PMC - PubMed
    1. Mitra A, Barua A, Huang L, Ganguly S, Feng Q, He B, From bench to bedside: The history and progress of CAR T cell therapy. Front. Immunol. 14, 1188049 (2023). - PMC - PubMed
    1. Esensten JH, Helou YA, Chopra G, Weiss A, Bluestone JA, CD28 costimulation: From mechanism to therapy. Immunity 44, 973–988 (2016). - PMC - PubMed
    1. Hartono C, Muthukumar T, Suthanthiran M, Immunosuppressive drug therapy. Cold Spring Harb. Perspect. Med. 3, a015487 (2013). - PMC - PubMed

Publication types

MeSH terms