. 2025 Mar 14;11(11):eads4200.
doi: 10.1126/sciadv.ads4200. Epub 2025 Mar 14.

Ectopic expression of testis-specific transcription elongation factor in driving cancer

Affiliations

Ectopic expression of testis-specific transcription elongation factor in driving cancer

Bin Zheng et al. Sci Adv. .

Abstract

The testis-specific BET protein BRDT structurally resembles the ubiquitous BRD4 and is misexpressed in cancer, and we show that BRDT misexpression may affect lung cancer progression. BRDT knockdown in lung cancer cells slowed tumor growth and prolonged survival in a xenograft model. Comparative characterization of PTEFb complex participation and chromatin binding indicates BRD4-redundant and BRD4-distinct BRDT functions. Unlike dual depletion, individual BRD4 or BRDT knockdown did not impair transcriptional responses to hypoxia in BRDT-expressing cells, consistent with redundant function. However, BRD4 depletion/BRDT complementation revealed that BRDT can also release paused RNA polymerase II independently of its bromodomains as we previously demonstrated not to be required for Pol II pause/release function of BRD4, underscoring the functional importance of the C-terminal domains in both BRD4 and BRDT and their potential as therapeutic targets in solid tumors. Based on this study, future investigations should explore BRD4-distinct BRDT functions and BRDT misexpression driving cancer pathogenesis.


Figures
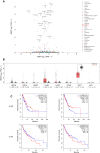
Fig. 1.
Fig. 1.. BRDT is ectopically expressed in lung cancers.
(A) Plot showing the transcript expression levels of the ubiquitously expressed BRD4 versus the testis-specific BRDT across different cancer cell lines. Lung cancer–derived cell lines are labeled. Expression levels are presented as log2-transformed TPM (transcripts per million) with a pseudocount of 1 [log2 (TPM + 1)]. (Expression data downloaded from DepMap.). (B) Elevated gene expression of BRDT in various solid tumors (T, in red) compared to matched normal tissue samples (N, in black) from the TCGA project database (analyzed via the GEPIA2 web server). BRCA (breast-invasive carcinoma), ESCA (esophageal carcinoma), HNSC (head and neck squamous cell carcinoma), LUAD, LUSC, STAD (stomach adenocarcinoma), TGCT, and UCS (uterine carcinosarcoma). Matched normal samples were obtained from TCGA and Genotype-Tissue Expression Program (GTEx). Expression levels are presented as log2 (TPM + 1). (C) Kaplan-Meier curves comparing overall survival in patients with defined subtypes of LUAD (proximal inflammatory, proximal proliferative, and terminal respiratory unit) or LUSC (basal expression, classical expression, primitive expression, and secretory expression) whose tumors express low (below median, blue) versus high (above median, red) levels of BRDT (left) or BRD4 (right). The 95% confidence intervals are plotted as dashed lines. The y axis represents the percentage of patients surviving (percent survival) at a given time interval after diagnosis, represented on the x axis (months). HR was calculated on the basis of the Cox proportional hazards model, taking the high expression group as the intervention group [HR (high)].
Fig. 2.
Fig. 2.. Dox-induced BRDT knockdown impairs tumor growth in vitro and in vivo.
(A) Western blot analysis of Dox-induced BRDT knockdown in LUAD-derived NCI-H2009 cells with stable integration of BRDT-targeting (#1 to #3) or nontargeting (Scr) TetO-shRNA cassettes. dBET6 treatment in parental cells served as a positive control for BRDT depletion. (B) Colony formation assay in NCI-H2009 cells with integrated TetO-shRNA cassettes treated with or without Dox. (C) Left: Western blot confirming Dox-induced shRNA knockdown of BRDT expression in NCI-H2009 TetO-shBRDT cells before subcutaneous implantation into nude mice. Middle: Normalized tumor volume over the course of post-implantation treatment with phosphate-buffered saline (PBS) (n = 8, black) or Dox (n = 9, red). Right: Normalized tumor volume at day 44 post-implantation. BRDT knockdown significantly decreased NCI-H2009 xenograft tumor volume (**P = 0.0069, unpaired t test). (D) Left: Representative images of mice and excised tumors following treatment with PBS or Dox. Right: Kaplan-Meier curves comparing overall post-implantation survival. BRDT knockdown significantly increased overall survival in mice with NCI-H2009 xenograft tumors (****P < 0.0001, log rank test). (E) Representative histopathological staining of tumor tissue from mice treated with PBS (left) or Dox (right). Hematoxylin and eosin (H&E) staining is shown at top. IHC (with hematoxylin counterstain) is shown for the proliferation marker Ki-67, the apoptosis marker TUNEL, BRDT, and BRD4, with quantification of IHC-positive cells in four high-powered fields in each tumor (mean and SD shown). Scale bars, 50 μm (for BRDs) and 20 μm (others). Statistical analysis was performed using the unpaired t test. BRDT knockdown significantly reduced % Ki-67+ cells (****P < 0.0001) and significantly increased % TUNEL+ cells (****P < 0.0001). Significant reduction in % BRDT+ cells (**P = 0.0015) confirmed successful BRDT knockdown in vivo. No change was observed in % BRD4+ cells.
Fig. 3.
Fig. 3.. BRDT and BRD4 form similar and distinct complexes with PTEFb on active chromatin.
(A) Western blot for BRDT, BRD4, CCNT1, and CDK9 after size exclusion chromatography performed using benzonase-treated whole nuclear extracts from NCI-H510 cells. (B) Representative track example of ChIP-seq signal in NCI-H510 cells visualized with zoom-out view, showing colocalization of BRDT, BRD4, Pol II, and CDK9 at active chromatin regions marked by H3K27ac. (C) Global heatmaps of ChIP-seq signals for BRD4, CDK9, BRDT, and Pol II indicating their genome-wide colocalization at active chromatin regions (marked by H3K4me1, H3K4me3, and H3K27ac and lack of H3K27me3). (D) Venn diagram for peak overlaps among BRD4, BRDT, and CDK9 genome wide.
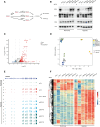
Fig. 4.
Fig. 4.. BRDT can compensate for loss of BRD4 in the transcriptional response to hypoxic stress.
(A) Schematic diagram of the experimental design for evaluating the impact of BRD4, BRDT, or dual BRD4/BRDT loss on transcriptional responses to hypoxia. (B) Western blot for BRD4, BRDT, and CDK9 in NCI-H510 cells under conditions of normoxia (~18% oxygen, left) or hypoxia (1% oxygen, right) after transfection of sgRNA targeting BRD4 or BRDT, showing the efficiency of BRD4 or BRDT knockdown by each sgRNA. Nontargeting sgRNA (sgCtrl) is the negative control, and dBET6 treatment (dual depletion of both BRD4 and BRDT) is the positive control for knockdown efficiency at the protein level. (C) Volcano plot of genes differentially expressed in response to hypoxic stress in the cells described in (B), with representative hypoxia-induced genes highlighted. Neither BRD4 nor BRDT was affected by hypoxia. (D) PCA analysis of RNA-seq data in cells cultured under normoxic or hypoxic conditions after depletion of either BRD4 or BRDT via individual sgRNA or after dual depletion of both BRD4 and BRDT by dBET6 treatment [as described in (B)]. (E) Track visualization of RNA-seq signal at the representative hypoxia-responsive gene NDRG1 locus showing transcriptional activity induced by hypoxia that was lost upon simultaneous depletion of BRD4 and BRDT by dBET6 treatment but remained upon individual depletion of either BRD4 or BRDT by sgRNA. (F) Heatmap showing a cluster of hypoxia-responsive genes for which transcriptional induction in response to hypoxia was strongly diminished by dBET6 treatment, but not by sgRNA targeting either BRD4 or BRDT. PC, principal component.
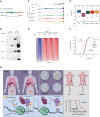
Fig. 5.
Fig. 5.. BRDT releases promoter-proximal paused Pol II in a manner similar to that of BRD4.
(A) Schematic diagram of the Dox-inducible, N-terminally GFP-tagged BRDT constructs BRDT-FL (full-length BRDT) and BRDT-C (bromodomain-less C-terminal BRDT fragment). (B) Western blot for GFP and the PTEFb subunits CCNT1 and CDK9 after immunoprecipitation of the GFP-tagged BRDT constructs showing that both BRDT-FL and BRDT-C can interact with PTEFb. (C) Representative track example at the HSPA8 gene locus of Pol II ChIP-seq showing Pol II pausing upon depletion of endogenous BRD4 by auxin treatment and comparable rescue by BRD4-FL, BRDT-FL, and BRDT-C. (D) Heatmap of log2FC in Pol II occupancy for the rescue experiment in (C) showing a genome-wide increase in Pol II signal at promoters and a decrease in signal at gene bodies upon auxin-induced BRD4 depletion. BRD4-FL, BRDT-FL, and BRDT-C all rescue the genome-wide shift in Pol II occupancy in a similar manner. (E) Boxplot of log2PRR calculated from Pol II ChIP-seq signal at promoters versus gene bodies for the rescue experiment in (C). (F) Empirical cumulative distribution function plot of log2PRR for the rescue experiment in (C). (G) Putative model for ectopically expressed BRDT in lung cancer promoting tumor progression. Testis-specific BRDT has also been found in multiple cancers, with especially high expression levels found in common forms of lung cancer. BRDT knockdown (KD) impairs colony formation for lung cancer cells in vitro and reduces xenograft tumor growth in vivo, extending animal survival. BRDT can mediate gene expression by partnering with PTEFb to release paused Pol II, similar to BRD4, and BRDT can also functionally compensate for BRD4 in the transcriptional response to hypoxia. The C terminus of BRDT could be a potential therapeutic target for solid tumors, where hypoxic gene expression is critical.

References

    1. Chen F. X., Smith E. R., Shilatifard A., Born to run: Control of transcription elongation by RNA polymerase II. Nat. Rev. Mol. Cell Biol. 19, 464–478 (2018). - PubMed
    1. Core L., Adelman K., Promoter-proximal pausing of RNA polymerase II: A nexus of gene regulation. Genes Dev. 33, 960–982 (2019). - PMC - PubMed
    1. Aoi Y., Shilatifard A., Transcriptional elongation control in developmental gene expression, aging, and disease. Mol. Cell 83, 3972–3999 (2023). - PubMed
    1. Lin C., Smith E. R., Takahashi H., Lai K. C., Martin-Brown S., Florens L., Washburn M. P., Conaway J. W., Conaway R. C., Shilatifard A., AFF4, a component of the ELL/P-TEFb elongation complex and a shared subunit of MLL chimeras, can link transcription elongation to leukemia. Mol. Cell 37, 429–437 (2010). - PMC - PubMed
    1. Luo Z., Lin C., Shilatifard A., The super elongation complex (SEC) family in transcriptional control. Nat. Rev. Mol. Cell Biol. 13, 543–547 (2012). - PubMed

MeSH terms