. 2025 Mar 14;11(11):eadr4443.
doi: 10.1126/sciadv.adr4443. Epub 2025 Mar 14.

Inhibiting EZH2 complements steroid effects in Duchenne muscular dystrophy

Affiliations

Inhibiting EZH2 complements steroid effects in Duchenne muscular dystrophy

Eun Young Jeon et al. Sci Adv. .

Abstract

Duchenne muscular dystrophy (DMD) is a devastating X-linked disorder caused by dystrophin gene mutations. Despite recent advances in understanding the disease etiology and applying emerging treatment methodologies, glucocorticoid derivatives remain the only general therapeutic option that can slow disease development. However, the precise molecular mechanism of glucocorticoid action remains unclear, and there is still need for additional remedies to complement the treatment. Here, using single-nucleus RNA sequencing and spatial transcriptome analyses of human and mouse muscles, we investigated pathogenic features in patients with DMD and palliative effects of glucocorticoids. Our approach further illuminated the importance of proliferating satellite cells and revealed increased activity of a signal transduction pathway involving EZH2 in the patient cells. Subsequent administration of EZH2 inhibitors to Dmd mutant mice resulted in improved muscle phenotype through maintaining the immune-suppressing effect but overriding the muscle weakness and fibrogenic effects exerted by glucocorticoids. Our analysis reveals pathogenic mechanisms that can be readily targeted by extant therapeutic options for DMD.


Figures

Fig. 1.
Fig. 1.. Profiles of human and mouse DMD muscle tissues.
(A) Human and mouse tissues used in the study. DFZ denotes deflazacort. (B and E) Uniform Manifold Approximation and Projection (UMAP) visualization of 60,886 nuclei from human (B) and 21,295 nuclei from mouse (E) tissues. FAP, fibro-adipogenic progenitors; EC, endothelial cells; LymphEC, lymphatic endothelial cells. (C and F) Cell type proportions in human (C) and mouse (F) samples. The five control samples are positioned in the uppermost bolded box of each column, highlighted in the brightest shade. The three BMD samples are situated in the middle bolded box, whereas the three DMD samples are located in the lowermost bolded box, shaded with the darkest color. WT, wild type. (D and G) Changes in cell type proportion by disease state in human (D) and mouse (G) samples. (H) Cell type mapping on Visium slides of human DMD and healthy muscle sections. Scale bar, 1 mm. (I) Dot plot illustrating co-occurrence of spatially resolved cell types in regions defined by cell2location (78). The dotted rectangle emphasizes the co-occurrence of satellite cells and immune cells in region #1 (left). Spatial heatmap showing the location of region #1 (right). (J) Magnified view of the dotted rectangle in (I) (right), emphasizing colocalized expression of satellite, myeloid, and lymphoid markers in the DMD #2 sample.
Fig. 2.
Fig. 2.. Altered gene expression in human and mouse tissues with DMD mutation and deflazacort treatment.
(A, D, F, G, and H) Heatmaps of DEGs in each cell type by species and disease status. (A) Myeloid cells. (D) Lymphoid cells. (F) Satellite cells. (G) Muscle cells. (H) FAP cells. FC, fold change; GTPase, guanosine triphosphatase; ECM, extracellular matrix. (B and E) Schematic representation of the roles of DEGs in corresponding heatmaps. (B) Actin remodeling and cell migration genes in myeloid cells. (E) B cell differentiation, survival, and Ig production genes in lymphoid cells. (C) Diagram of the exemplary NR3C1 ChIP-seq peak locus on DOCK10, a DEG found in the myeloid cells. DEX denotes dexamethasone. (I) TIMP1 expression in FAP clusters. (J) Visualization of FAP clusters by cell2location mapping on Visium slides of human patient muscle sections. Scale bars, 1 mm.
Fig. 3.
Fig. 3.. Proliferating satellite cells in patients with DMD lead to increased signal transduction in a pathway involving EZH2 and cell cycle progressors.
(A) Heatmap of genes whose expressions vary over pseudo-temporal ordering from satellite cells (S) to myocytes (M) (left). Gene ontology (GO) terms enriched among these genes (middle). Numbers in bar graphs indicate numbers of input genes/genes in annotation. Plots of log-transformed counts and the fitted values of control, BMD, and DMD patient cells (right). (B and C) Scatterplots of cell cycle scores in all cell types by disease status. Cells in different disease groups are plotted separately in (B) but plotted together in (C). (B) Satellite cells, FAP cells, and EC cells. (C) Type II muscles, Type I muscles, Myeloid, Lymphoid, Pericyte, LymphEC, Adipocyte, and Mast cells. Control samples are shown in gray, BMD samples are shown in pink, and DMD samples are represented in red. Cells were considered positive for cell proliferation if they harbor positive scores for either G2M or S. (D) Violin plots depicting DEGs in proliferating satellite cells. (E) Table displaying the number of samples and corresponding cell counts (in parentheses) included in our and previous studies (left). Violin plots of both human EZH2 and mouse Ezh2 expression in our and public data. n.s. denotes P value > 0.05; *P ≤ 0.05; **P ≤ 0.01; ***P ≤ 0.001; ****P ≤ 0.0001. N.A., not applicable.
Fig. 4.
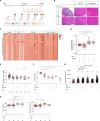
Fig. 4.. Treatment with EZH2 inhibitors improved muscle phenotype in D2-mdx mice.
(A) Schematic representation of the experimental setup involving mouse drug administration. (B) H&E staining of muscle tissues from the 8- to 10-week-old mice after injection of deflazacort and/or GSK126 and/or tazemetostat (Taz). Scale bar, 100 μm. (C) Heatmap showing the quantification of Masson’s trichrome images for fibrosis architecture features from mice with or without GSK126 treatment. Feature names (row) are listed separately in data S2. (D) Composite fibrosis scores calculated on the basis of (C). The number indicates the number of mice used. (E) Boxplot showing the quantification of area of collagen relative to untreated D2-mdx in mice with or without drug treatment based on Masson’s trichrome–stained images. The number indicates the number of slides used. (F) Boxplot showing the percentage of central nuclei in muscle fibers. (G) Boxplot showing cross-sectional areas of muscle fibers. Asterisks without brackets are the comparison with the control. (H) Boxplots showing grip strength (left) and T-bar grip strength (right) of 8- to 10-week-old mice after injection of deflazacort and/or tazemetostat. Red dotted lines indicate the mean. The number represents the triplication of the initial count of mice used. *P ≤ 0.05; **P ≤ 0.01; ****P ≤ 0.0001.
Fig. 5.
Fig. 5.. EZH2 inhibitor maintains the immune suppressing effect and overrides the increased fibrosis induced by deflazacort.
(A) UMAP visualization of 37,464 nuclei from muscle tissues of wild-type or D2-mdx mice with drug treatments. (B) Cell type proportion by treatment status. (C) Scatterplots of cell cycle scores in myeloid cells by treatment status. (D) Heatmap of the DEGs in myeloid cells by treatment status. (E) Heatmap of the DEGs in FAP cells shown in Fig. 2H by treatment status.
Fig. 6.
Fig. 6.. EZH2 inhibitor overrides the muscle weakness effect exerted by deflazacort through stimulating muscle differentiation.
(A) Heatmap of differentially enriched regulators for each cell type in GSK126-injected mice. (B) Heatmap of Myog expression in satellite cells by treatment status. (C) t-SNE visualization of Pax7 and Myog transcription factor activities in cells of wild-type and GSK126-injected mice. (D) Heatmap of the muscle cell DEGs shown in Fig. 2G by treatment status. (E) Number of genes differentially expressed in the proliferating satellite cells and bound by EZH2 (left). Numbers in bar graphs indicate numbers of input genes/genes in annotation. Schematic representation of the roles of overlapping genes that are engaged in cell polarity group (right). (F) Diagram of the exemplary EZH2 ChIP-seq peak locus on JAM3, a DEG found in the proliferating satellite cells and bound by EZH2. (G) Heatmap of genes whose expression varies over pseudotemporal ordering from satellite cells to the differentiated myocyte state (left). Numbers in bar graphs indicate input genes/genes in annotation. Plots of log-transformed counts and the fitted values of wild-type mice, D2-mdx mice, and D2-mdx mice with deflazacort and GSK126 injection (right).

References

    1. Duan D., Goemans N., Takeda S., Mercuri E., Aartsma-Rus A., Duchenne muscular dystrophy. Nat. Rev. Dis. Primers. 7, 13 (2021). - PMC - PubMed
    1. Mah J. K., Korngut L., Dykeman J., Day L., Pringsheim T., Jette N., A systematic review and meta-analysis on the epidemiology of Duchenne and Becker muscular dystrophy. Neuromuscul. Disord. 24, 482–491 (2014). - PubMed
    1. Hoy S. M., Delandistrogene moxeparvovec: First approval. Drugs 83, 1323–1329 (2023). - PubMed
    1. FDA, FDA Approves First Gene Therapy for Treatment of Certain Patients with Duchenne Muscular Dystrophy (FDA, 2023); https://fda.gov/news-events/press-announcements/fda-approves-first-gene-....
    1. Lek A., Wong B., Keeler A., Blackwood M., Ma K., Huang S., Sylvia K., Batista A. R., Artinian R., Kokoski D., Parajuli S., Putra J., Carreon C. K., Lidov H., Woodman K., Pajusalu S., Spinazzola J. M., Gallagher T., LaRovere J., Balderson D., Black L., Sutton K., Horgan R., Lek M., Flotte T., Death after high-dose rAAV9 gene therapy in a patient with Duchenne's muscular dystrophy. N. Engl. J. Med. 389, 1203–1210 (2023). - PMC - PubMed

MeSH terms