. 2025 Jul 8;9(13):3315-3330.
doi: 10.1182/bloodadvances.2024015621.

Mature megakaryocytes acquire immune characteristics in a mouse model of aplastic anemia

Affiliations

Mature megakaryocytes acquire immune characteristics in a mouse model of aplastic anemia

Ashvind Prabahran et al. Blood Adv. .

Abstract

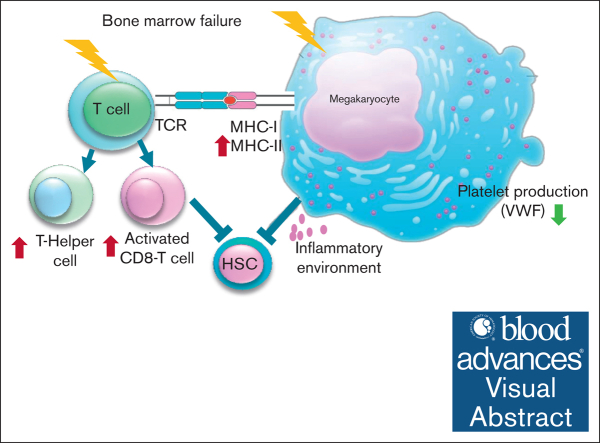
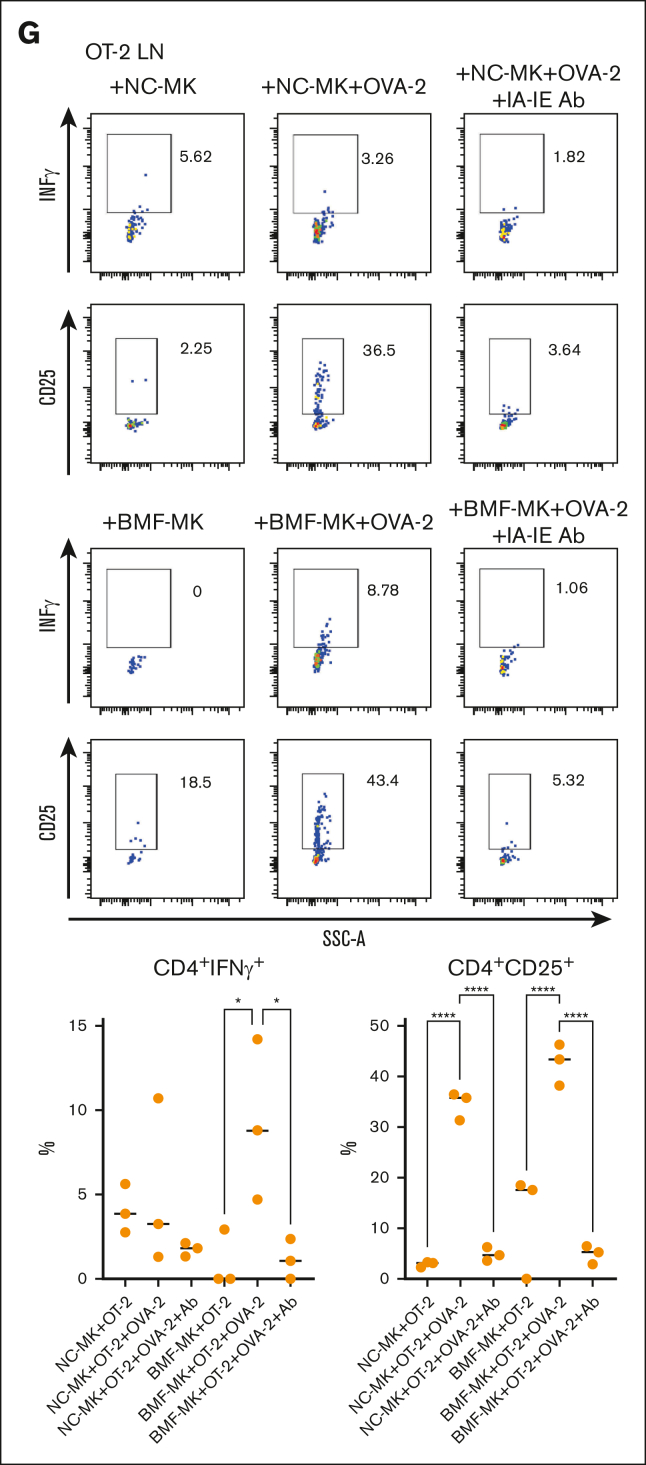
Megakaryocytes (MKs) serve diverse roles beyond platelet production, including hematopoietic stem cell maintenance and immune response modulation. In our mouse model of immune bone marrow failure (BMF), we observed the unexpected persistence of MKs despite thrombocytopenia. These MKs exhibited heightened expression of immune activation markers, such as IA-IE and CD53, compared with MKs from healthy controls. Single-cell RNA sequencing analysis (scRNA-seq) revealed upregulation of immune response pathways and downregulation of pathways related to platelet function and homeostasis in MKs from animals with marrow failure (BMF). Electron microscopy demonstrated that these MKs had fewer cytoplasmic extensions, reduced α-granules, and a less developed demarcation membrane system. MKs from BMF animals had reduced ability to produce platelets compared with normal control MKs. Interestingly, when cocultured with BMF-derived T cells, MKs from healthy mice acquired immune characteristics. Functionally, MKs from BMF mice suppressed hematopoietic stem cell colony formation in coculture experiments. Mechanistically, these MKs appeared to act as antigen-presenting cells, capable of T-cell activation. Notably, similar immune activation of MKs was observed in patients with aplastic anemia through scRNA-seq. These findings highlight the immune functions of mature MKs in an alloimmune model of BMF, with potential implications for human aplastic anemia and related hematologic disorders.


Conflict of interest statement

Conflict-of-interest disclosure: The authors declare no competing financial interests.

Figures

None
Graphical abstract
Figure 1.
Figure 1.
BMF induced without TBI. (A) Comparison of MK number between control (CON) and TBI. Green staining denotes CD41 APC channel, blue nuclei staining with DAPI (4′,6-diamidino-2-phenylindole). (B) Male CByB6F1 mice were infused with 30 to 40 million LN cells from B6-DsRed donors without TBI. (C) The peripheral blood was analyzed for white blood cells (WBCs), RBCs, platelets (PLTs), and BM cell number (BM) over the course of BMF induced without TBI. (D) Proportion of DsRed lymphocytes at different time points shown as representative flow cytometry plots. (E) Individual observations of proportions of DsRed lymphocytes, CD4+, CD8+ T cells, and Fas expression on residual BM (RBM, excluding CD4 and CD8 T cells). CON (n = 11), day 7 (n = 5), day 10 (n = 5), day 14 (n = 5), and day 17 (n = 5). D, day; SSC-A, side scatter area.
Figure 2.
Figure 2.
CD41+ cells persist over the course of BMF with increased expression of IA-IE and CD53. (A) Representative flow cytometry plots of a gating strategy used to identify large cells with CD41+ expression. (B) Representative flow cytometry plots demonstrating CD41+, the large-cell population over the course of BMF, and individual results of absolute number of CD41+ large cells. (C) Changes of absolute numbers of CD11b during BMF. Representative flow cytometry plots showing IA-IE and CD53 in the CD41+ large-cell population over the course of BMF, and individual results of absolute number of IA-IE+CD41+ cells (D) and CD53+CD41+ cells (E). CON (n = 11), day 7 (n = 5), day 10 (n = 5), day 14 (n = 5), and day 17 (n = 5). (F) Frequencies and absolute numbers of the ploidy of MKs in normal mice and BMF mice. (G) Frequencies and absolute numbers of the ploidy of IA-IE+ MKs in normal mice and BMF mice. ∗P < .05; ∗∗P < .01; ∗∗∗P < .001; ∗∗∗∗P < .0001. CON, control; D, day; FSC-A, forwad scatter area; NC, normal control; SSC-A, side scatter area.
Figure 2.
Figure 2.
CD41+ cells persist over the course of BMF with increased expression of IA-IE and CD53. (A) Representative flow cytometry plots of a gating strategy used to identify large cells with CD41+ expression. (B) Representative flow cytometry plots demonstrating CD41+, the large-cell population over the course of BMF, and individual results of absolute number of CD41+ large cells. (C) Changes of absolute numbers of CD11b during BMF. Representative flow cytometry plots showing IA-IE and CD53 in the CD41+ large-cell population over the course of BMF, and individual results of absolute number of IA-IE+CD41+ cells (D) and CD53+CD41+ cells (E). CON (n = 11), day 7 (n = 5), day 10 (n = 5), day 14 (n = 5), and day 17 (n = 5). (F) Frequencies and absolute numbers of the ploidy of MKs in normal mice and BMF mice. (G) Frequencies and absolute numbers of the ploidy of IA-IE+ MKs in normal mice and BMF mice. ∗P < .05; ∗∗P < .01; ∗∗∗P < .001; ∗∗∗∗P < .0001. CON, control; D, day; FSC-A, forwad scatter area; NC, normal control; SSC-A, side scatter area.
Figure 3.
Figure 3.
Persistency of MKs and infiltration of T cells in the BM over the course of BMF. (A) Image processing workflow for multi-photon images. (B) MPM imaging of mouse sterna with CD41 APC channel (teal), demonstrating persisting MK signal over the course of BMF. (C) Large CD41+ cells coexpress CD42d, split channel image of cells identified as MKs, left to right, CD41 channel, CD42d channel, DAPI channel, merged channel. (D) Individual value plots of MK per image volume over the course of BMF. (E) MPM imaging of DsRed lymphocytes infiltrating into the BM cavity over the course of BMF. D, day; DAPI, 4′,6-diamidino-2-phenylindole; PE, phycoerythrin.
Figure 4.
Figure 4.
MK scRNA-seq. (A) UMAP of scRNA-seq results with identification of different clusters including MKs, T cells, B cells, granulocytes, RBCs, and macrophages. Orange (day-14 BMF), blue (CON). (B) Confirmation of MK cluster by high expression of glycoprotein V (Gp-5), platelet factor 4 (Pf-4), integrin 2 β (Itga2β, Cd41), tubulin β class 1 (Tubb1). (C) GSEA of differentially upregulated gene pathways in day-14 BMF MKs compared with control MKs. (D) Upregulation of genes pertaining to immune activation and antigen presentation and reduction in genes pertaining to platelet function. Individual value plots of Stat1, H2-K1, Nlrc5, Vwf, Igf1r, and Akt3 gene expression of day-14 BMF (orange) and CON (blue). (E) MK subsets. MKs were extracted from whole BM scRNA-seq (panel A), and MK Clusters 0 to 5 were identified. These MKs were classified into 3 groups based on the gene pathways (F). (G) Distribution of BMF and control groups across MK clusters. CA2, calcium2+; CON, normal control; iMK, immune megakaryocyte; IL6, interleukin 6; NES, normalized enrichment score.
Figure 4.
Figure 4.
MK scRNA-seq. (A) UMAP of scRNA-seq results with identification of different clusters including MKs, T cells, B cells, granulocytes, RBCs, and macrophages. Orange (day-14 BMF), blue (CON). (B) Confirmation of MK cluster by high expression of glycoprotein V (Gp-5), platelet factor 4 (Pf-4), integrin 2 β (Itga2β, Cd41), tubulin β class 1 (Tubb1). (C) GSEA of differentially upregulated gene pathways in day-14 BMF MKs compared with control MKs. (D) Upregulation of genes pertaining to immune activation and antigen presentation and reduction in genes pertaining to platelet function. Individual value plots of Stat1, H2-K1, Nlrc5, Vwf, Igf1r, and Akt3 gene expression of day-14 BMF (orange) and CON (blue). (E) MK subsets. MKs were extracted from whole BM scRNA-seq (panel A), and MK Clusters 0 to 5 were identified. These MKs were classified into 3 groups based on the gene pathways (F). (G) Distribution of BMF and control groups across MK clusters. CA2, calcium2+; CON, normal control; iMK, immune megakaryocyte; IL6, interleukin 6; NES, normalized enrichment score.
Figure 5.
Figure 5.
Functions of BMF-derived MKs. (A) Representative electron microscopy images of enriched MKs from normal mice and BMF mice. N, nucleus (black arrows); DMS, demarcation membrane system (green arrows); proplatelets (P, red arrows); α-granules (A, purple arrows). Scale bars = 2 μm under 1200× magnification, and 2 μm under 3000× magnification, respectively (from pooled 15 BMF mice and 10 normal mice, respectively). (B) Comparison of platelet production between BMF MK and normal control MKs. MKs (3 × 10⁴/mL) from pooled 10 BMF mice and 5 normal mice were seeded into 96-well plates, respectively, and cultured for 6 days as described previously, then counted manually. (C) BMF-derived MKs suppress colony forming capacity of normal BM cells. MKs were isolated from pooled samples of BMF mice (n = 30) and control CByB6F1 mice (n = 15). BM cells (2 × 10⁴) from normal CByB6F1 mice were incubated with BMF-derived or normal control MKs (8000 cells) at 37°C for 1 hour, then were mixed in semisolid methylcellulose medium, and plated on 35-mm culture dishes. Cells were cultured at 37°C with 5% CO2. Colonies were counted on day 7. Data shown were from 2 separate experiments. CFU, colony forming unit. (D) BMF-derived MKs induce apoptosis and death of normal BM cells. MKs (2 × 10⁴ cells) isolated from BMF mice (n = 3 pools) or control CByB6F1 mice (n = 2 pools) were incubated with BM cells (2 × 10⁵ cells) from normal CByB6F1 mice at 37°C for overnight, 7AAD and annexin V positivity on BM cells was evaluated by flow cytometry. BMF-MK, normal BM cells cocultured with BMF-derived MKs; NC-MK, normal BM cells cocultured with normal mice-derived MKs. (E) BMF-derived T cells induce upregulation of IA-IE on normal MKs after coculture. Representative plot of IA-IE expression on MKs after coculture with T cells for overnight. Individual value plots of IA-IE on MKs after coculture with T cells. (F) OT-1 CD8+ T-cell response mediated by OVA-1 peptide-pulsed MKs. (G) OT-2 CD4+ T-cell response mediated by OVA-2 peptide-pulsed MKs. Ten thousand flow-sorted normal MKs (a fraction of pooled from 10 mice) or BMF MKs (a fraction of pooled from 15 mice) were pulsed with OVA-1 or OVA-2 peptides (200 μg) for 12 hours. After wash with phosphate-buffered saline, they were cocultured with 1 × 10⁵ LN cells collected from OT-1 or OT-2 mice for an additional 12 hours. OT-1/2 LN cells + BMF MKs or normal control MKs without peptides served as negative controls. MK:LN ratio = 1 × 10⁴:1 × 10⁵. To test MHC-2–dependent OT-2 CD4+ T-cell response, anti-IA-IE antibody (250 μg/mL) was added to MKs before OVA-2 peptide pulsing. Representative flow cytometry plots and results are shown. CD8+ T cells and CD4+ T cells were gated in panels F and G, respectively. ∗P < .05; ∗∗P < .01; ∗∗∗P < .001. 7AAD, 7-aminoactinomycin; DMS, demarcation membrane system; NC, normal control; PLT, platelet; SSC-A, side scatter area.
Figure 5.
Figure 5.
Functions of BMF-derived MKs. (A) Representative electron microscopy images of enriched MKs from normal mice and BMF mice. N, nucleus (black arrows); DMS, demarcation membrane system (green arrows); proplatelets (P, red arrows); α-granules (A, purple arrows). Scale bars = 2 μm under 1200× magnification, and 2 μm under 3000× magnification, respectively (from pooled 15 BMF mice and 10 normal mice, respectively). (B) Comparison of platelet production between BMF MK and normal control MKs. MKs (3 × 10⁴/mL) from pooled 10 BMF mice and 5 normal mice were seeded into 96-well plates, respectively, and cultured for 6 days as described previously, then counted manually. (C) BMF-derived MKs suppress colony forming capacity of normal BM cells. MKs were isolated from pooled samples of BMF mice (n = 30) and control CByB6F1 mice (n = 15). BM cells (2 × 10⁴) from normal CByB6F1 mice were incubated with BMF-derived or normal control MKs (8000 cells) at 37°C for 1 hour, then were mixed in semisolid methylcellulose medium, and plated on 35-mm culture dishes. Cells were cultured at 37°C with 5% CO2. Colonies were counted on day 7. Data shown were from 2 separate experiments. CFU, colony forming unit. (D) BMF-derived MKs induce apoptosis and death of normal BM cells. MKs (2 × 10⁴ cells) isolated from BMF mice (n = 3 pools) or control CByB6F1 mice (n = 2 pools) were incubated with BM cells (2 × 10⁵ cells) from normal CByB6F1 mice at 37°C for overnight, 7AAD and annexin V positivity on BM cells was evaluated by flow cytometry. BMF-MK, normal BM cells cocultured with BMF-derived MKs; NC-MK, normal BM cells cocultured with normal mice-derived MKs. (E) BMF-derived T cells induce upregulation of IA-IE on normal MKs after coculture. Representative plot of IA-IE expression on MKs after coculture with T cells for overnight. Individual value plots of IA-IE on MKs after coculture with T cells. (F) OT-1 CD8+ T-cell response mediated by OVA-1 peptide-pulsed MKs. (G) OT-2 CD4+ T-cell response mediated by OVA-2 peptide-pulsed MKs. Ten thousand flow-sorted normal MKs (a fraction of pooled from 10 mice) or BMF MKs (a fraction of pooled from 15 mice) were pulsed with OVA-1 or OVA-2 peptides (200 μg) for 12 hours. After wash with phosphate-buffered saline, they were cocultured with 1 × 10⁵ LN cells collected from OT-1 or OT-2 mice for an additional 12 hours. OT-1/2 LN cells + BMF MKs or normal control MKs without peptides served as negative controls. MK:LN ratio = 1 × 10⁴:1 × 10⁵. To test MHC-2–dependent OT-2 CD4+ T-cell response, anti-IA-IE antibody (250 μg/mL) was added to MKs before OVA-2 peptide pulsing. Representative flow cytometry plots and results are shown. CD8+ T cells and CD4+ T cells were gated in panels F and G, respectively. ∗P < .05; ∗∗P < .01; ∗∗∗P < .001. 7AAD, 7-aminoactinomycin; DMS, demarcation membrane system; NC, normal control; PLT, platelet; SSC-A, side scatter area.
Figure 6.
Figure 6.
IFN-γ induces immune characteristics in MKs. (A) The frequencies of MKs in the total BM after IFN-γ injection. (B) The frequencies of IA-IE+ MKs after IFN-γ injection. (C) Frequencies and absolute numbers of the ploidy of MKs in normal mice and IFN-γ–injected mice. (D) Frequencies and absolute numbers of the ploidy of IA-IE+ MKs in normal mice and IFN-γ–injected mice. Representative flow cytometry plots and results are shown, n = 10 mice for each group. NC, normal MKs; IFN-γ, MKs from IFN-γ–injected mice. ∗∗P < .01. SSC-A, side scatter area.
Figure 7.
Figure 7.
Immune activation pathways are upregulated in the MKs from patients with AA demonstrated by scRNA-seq. (A) A UMAP plot of single BM cell gene expression of patients with AA (n = 9) and healthy controls (n = 4). Cells are colored by types (erythroblast, MK, myeloid, NK, CD8+ T cell, CD4+ T cell, and B/plasma cells). Expression of cell-type signature genes are highlighted in UMAP plots. (B) GSEA of expressed genes in MKs from patients with AA compared with those in healthy donors. Normalized enrichment scores (NES) for the GSEA pathways are plotted, showing higher enrichment of the inflammatory pathways in MKs from patients with AA. IL2/6, interleukin-2/6.

References

    1. Young NS. Aplastic anemia. N Engl J Med. 2018;379(17):1643–1656. - PMC - PubMed
    1. Medinger M, Drexler B, Lengerke C, Passweg J. Pathogenesis of acquired aplastic anemia and the role of the bone marrow microenvironment. Front Oncol. 2018;8:587. - PMC - PubMed
    1. Kordasti S, Marsh J, Al-Khan S, et al. Functional characterization of CD4+ T cells in aplastic anemia. Blood. 2012;119(9):2033–2043. - PubMed
    1. Sun W, Wu Z, Lin Z, et al. Macrophage TNF-α licenses donor T cells in murine bone marrow failure and can be implicated in human aplastic anemia. Blood. 2018;132(26):2730–2743. - PMC - PubMed
    1. Zaimoku Y, Patel BA, Kajigaya S, et al. Deficit of circulating CD19(+) CD24(hi) CD38(hi) regulatory B cells in severe aplastic anaemia. Br J Haematol. 2020;190(4):610–617. - PMC - PubMed