. 2025 Apr 8;20(4):102448.
doi: 10.1016/j.stemcr.2025.102448. Epub 2025 Mar 13.

Metabolic remodeling in hiPSC-derived myofibers carrying the m.3243A>G mutation

Affiliations

Metabolic remodeling in hiPSC-derived myofibers carrying the m.3243A>G mutation

Gabriel E Valdebenito et al. Stem Cell Reports. .

Abstract

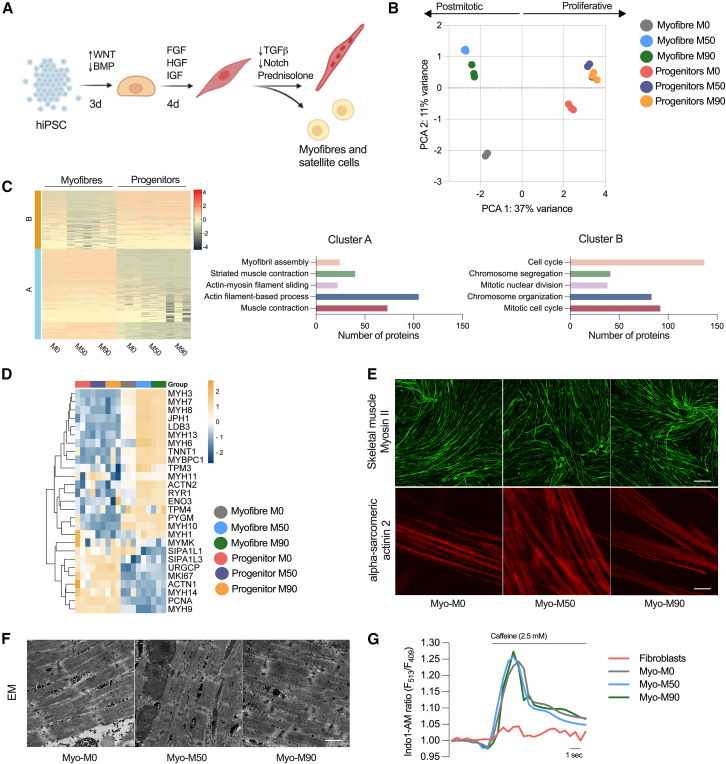
Mutations in mitochondrial DNA cause severe multisystem disease frequently associated with muscle weakness. The m.3243A>G mutation is the major cause of mitochondrial encephalomyopathy lactic acidosis and stroke-like episodes (MELAS). Experimental models that recapitulate the disease phenotype in vitro for disease modeling or drug screening are very limited. We have therefore generated hiPSC-derived muscle fibers with variable heteroplasmic mtDNA mutation load without significantly affecting muscle differentiation potential. The cells exhibit physiological characteristics of muscle fibers and show a well-organized myofibrillar structure. In cells carrying the m.3243A>G mutation, the mitochondrial membrane potential and oxygen consumption were reduced in relation to the mutant load. We have shown through proteomic, phosphoproteomic, and metabolomic analyses that the m.3243A>G mutation variably affects the cell phenotype in relation to the mutant load. This variation is reflected by an increase in the NADH/NAD+ ratio, which in turn influences key nutrient-sensing pathways in the myofibers. This model enables a detailed study of the impact of the mutation on cellular bioenergetics and on muscle physiology with the potential to provide a platform for drug screening.

Keywords: iPSC-derived myofibers; mitochondria; mtDNA; mtDNA mutations.


Conflict of interest statement

Declaration of interests The authors declare no competing interests.

Figures

Figure 1
Figure 1
The m.3243A>G mutation remains stable in hiPSCs and does not affect pluripotency or mitochondrial function (A) Schematic showing experimental approach to select hiPSC colonies carrying different levels of the m.3243A>G mutation. Created with BioRender.com. (B) Bright-field micrographs of hiPSC colonies in feeder-free conditions. Scale bar, 100 μm. (C) Mutant load quantification through ARMS-qPCR in hiPSC clones. n = 3 independent biological samples. (D) Cell respiratory capacity measured using the Seahorse XFe96 extracellular flux analyzer in hiPSC colonies. n = 3 independent biological samples, 5 culture wells per cell line. (E) Confocal images of hiPSC loaded with 25 nM tetramethylrhodamine methyl ester (TMRM) and 1μg/mL Hoechst 33342. Scale bar, 150 μM. (F) Averaged quantification mutant load of hiPSC colonies loaded with TMRM (n = 4 independent biological samples). Source data are provided as a Source Data file. All data were represented as mean ± SD, and data were analyzed by one-way ANOVA with Tukey’s multiple comparisons test (p < 0.05, ∗∗p < 0.01, ∗∗∗p < 0.001, ∗∗∗∗p < 0.0001).
Figure 2
Figure 2
Generation of myofibers derived from hiPSC bearing the m.3243A>G (A) Protocol used to direct the cells into the mesodermal fate and terminal differentiation of muscle progenitors. (B) Principal component analysis (PCA) of protein signature showing variance between sample groups (n = 3 replicates per condition). (C) K-means clustering heatmap of proteins (left, n = 3 replicates) and quantification of the top hits in both clusters. (D) Heatmap representing proteins associated with muscle maturation in myofibers and progenitors (n = 3 replicates). (E) Representative confocal images of myofibers stained with antibodies against skeletal muscle myosin (top; scale bar, 500 μM) and α-sarcomeric actinin 2 (bottom; scale bar, 20 μm). (F) Representative images of electron micrograph sections. At least 10 images were taken per condition. Scale bar, 1 μM. (G) Representative changes in Indo-1 AM fluorescence intensity after stimulation with 2.5 mM caffeine.
Figure 3
Figure 3
Myogenic efficiency and muscle phenotype in cells carrying the m.3243A>G mutation (A) Quantification of myogenic differentiation. Nuclei outside and inside α-actinin 2-positive cells are counted and then the ratio of nuclei inside α-actinin 2-positive cells/total nuclei is used to calculate the differentiation efficiency. Results are expressed as the percentage of the total population in the culture (n = 3 independent biological replicates). (B) Length and width of myocytes, myotubes, and myofibers over a period of 10 days of differentiation. Dotted and solid lines show the mean length and width of each day, while shaded area shows standard deviation (n = 3 independent biological replicates). (C) Total cellular protein content relative to genomic DNA in myotubes (n = 3 independent biological replicates). (D) Human Phenotype Ontology of the differentially expressed proteins between Myo-M50 vs. Myo Myo-M0 (top) and Myo-M90 vs. Myo-M0 (bottom). Source data are provided as a Source Data file. All data were represented as mean ± SD, and data were analyzed by one-way ANOVA with Tukey’s multiple comparisons test (p < 0.05, ∗∗p < 0.01, ∗∗∗p < 0.001, ∗∗∗∗p < 0.0001).
Figure 4
Figure 4
Myofibers expressing the m.3243A>G show mitochondrial dysfunction (A) Changes in mutation load from hiPSC to fully differentiated myofibers (n = 3 independent biological replicates). (B) Cell respiratory capacity measured using the Seahorse XFe96 extracellular flux analyzer in myofibers normalized by protein concentration (n = 3, 6 culture wells per experiment). (C) Confocal images of myofibers loaded with 25 nM tetramethylrhodamine methyl ester (TMRM, left) and quantification of mitochondrial membrane potential (right). n = 4 independent biological replicates. Scale bar, 100 μM. (D) Proteomic analysis of mitochondrial proteins. n = 4 independent biological replicates. (E) Levels of basal mitochondrial NAD(P)H measured by NAD(P)H autofluorescence, A.U: arbitrary units. n = 3 independent biological replicates. (F) Quantification of NAD(P)H redox index. n = 4 independent biological replicates. (G) Representative image of culture wells showing a change in the media color. (H) Absorbance ratio of phenol red. n = 3 independent biological replicates. (I) Fold changes in lactate concentration measured by CuBiAn. n = 3 independent biological replicates. (J) Top upregulated (orange) and downregulated (blue) Kyoto Encyclopedia of Genes and Genomes (KEGG) pathways from the proteomic dataset. Source data are provided as a Source Data file. All data were represented as mean ± SD, and data were analyzed by one-way ANOVA with Tukey’s multiple comparisons test (p < 0.05, ∗∗p < 0.01, ∗∗∗p < 0.001, ∗∗∗∗p < 0.0001).
Figure 5
Figure 5
The m.3243A>G rewires cytosolic and mitochondrial metabolism (A) Lactate to pyruvate ratio obtained from metabolomic analysis. n = 3 independent biological replicates. (B) Relative NADH/NAD+ ratio obtained from Peredox/mCherry measurements. n = 3 independent biological replicates. (C) Western blot of proteins associated to G3P and MA shuttles. (D–F and H) Quantification of proteins from (C). n = 3 independent biological replicates. (G) Ratio of protein expression of GPD2/GPD1. n = 3 independent biological replicates. (I) Representative western blot and quantification of phosphorylated S6 (S235/236) and AKT (S473) proteins. (J and K) AKT and mTOR substrate abundance obtained from phosphoproteomic dataset. n = 3 independent biological replicates. Source data are provided as a Source Data file. All data were represented as mean ± SD, and data were analyzed by one-way ANOVA with Tukey’s multiple comparisons test (p < 0.05, ∗∗p < 0.01, ∗∗∗p < 0.001, ∗∗∗∗p < 0.0001).

References

    1. Al Tanoury Z., Zimmerman J.F., Rao J., Sieiro D., McNamara H.M., Cherrier T., Rodríguez-delaRosa A., Hick-Colin A., Bousson F., Fugier-Schmucker C., et al. Prednisolone rescues Duchenne muscular dystrophy phenotypes in human pluripotent stem cell-derived skeletal muscle in vitro. Proc. Natl. Acad. Sci. USA. 2021;118 doi: 10.1073/pnas.2022960118. - DOI - PMC - PubMed
    1. Chal J., Pourquié O. Making muscle: skeletal myogenesis in vivo and in vitro. Development. 2017;144:2104–2122. doi: 10.1242/dev.151035. - DOI - PubMed
    1. Chen C., Guan M.X. Induced pluripotent stem cells: ex vivo models for human diseases due to mitochondrial DNA mutations. J. Biomed. Sci. 2023;30:82. doi: 10.1186/s12929-023-00967-7. - DOI - PMC - PubMed
    1. Chichagova V., Hallam D., Collin J., Buskin A., Saretzki G., Armstrong L., Yu-Wai-Man P., Lako M., Steel D.H., Steel D.H. Human iPSC disease modelling reveals functional and structural defects in retinal pigment epithelial cells harbouring the m.3243A > G mitochondrial DNA mutation. Sci. Rep. 2017;7 doi: 10.1038/s41598-017-12396-2. - DOI - PMC - PubMed
    1. Chung C.Y., Singh K., Kotiadis V.N., Valdebenito G.E., Ahn J.H., Topley E., Tan J., Andrews W.D., Bilanges B., Pitceathly R.D.S., et al. Constitutive activation of the PI3K-Akt-mTORC1 pathway sustains the m.3243 A > G mtDNA mutation. Nat. Commun. 2021;12:6409. doi: 10.1038/s41467-021-26746-2. - DOI - PMC - PubMed

Publication types

MeSH terms

Substances

LinkOut - more resources