Comparative Study
. 2025 Apr 8;20(4):102449.
doi: 10.1016/j.stemcr.2025.102449. Epub 2025 Mar 13.

Single-cell multiomic comparison of mouse and rat spermatogenesis reveals gene regulatory networks conserved for over 20 million years

Affiliations
Comparative Study

Single-cell multiomic comparison of mouse and rat spermatogenesis reveals gene regulatory networks conserved for over 20 million years

Eoin C Whelan et al. Stem Cell Reports. .

Abstract

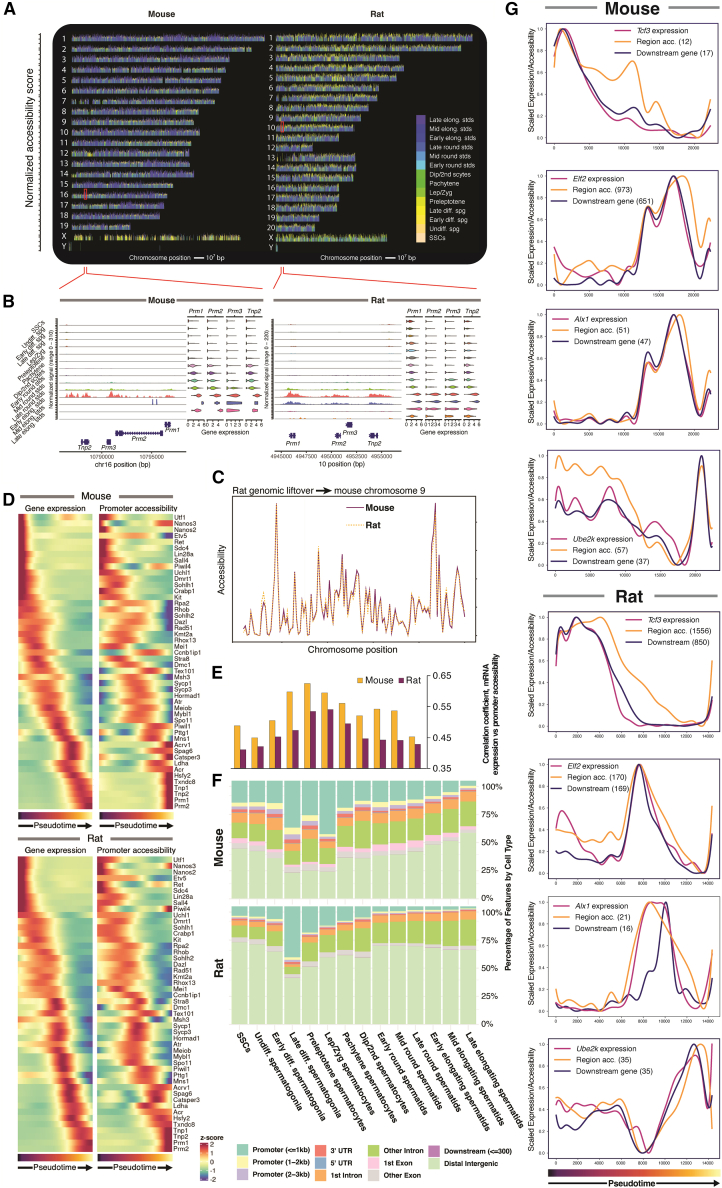
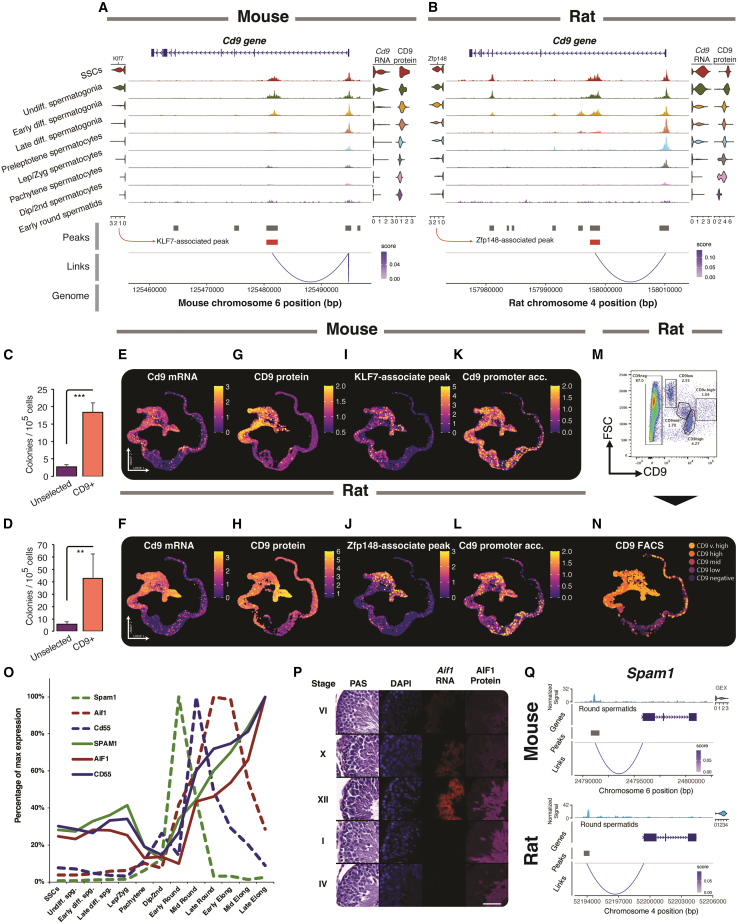
Spermatogenesis is driven by dramatic changes in chromatin regulation, gene transcription, and protein expression. To assess the mechanistic bases for these developmental changes, we utilized multiomic single-cell/nucleus RNA sequencing (sc/snRNA-seq) and single-nucleus assay for transposase-accessible chromatin with sequencing (snATAC-seq) to identify chromatin changes associated with transcription in adult mouse and rat testes. We characterized the relationships between the transcriptomes and chromatin of both species, including the divergent expression of Id4 in spermatogonial stem cells between species. Promoter accessibility and gene expression showed the greatest association during meiosis in both species. We mapped the cross-species conservation of putative regulatory regions for key spermatogenic genes, including Cd9 and Spam1, and investigated correlations and disconnects in chromatin accessibility, gene expression, and protein expression via antibody-derived tags. Using a gene regulatory network (GRN) model, we identified 40 core regulons conserved between mouse and rat germ cells, highlighting the relevance of chromatin-related factors in regulating the transcription of canonical genes across spermatogenesis.

Keywords: ATAC; RNA sequencing; differentiation; germ cells; mouse; multiomic; rat; single-cell; spermatogenesis.


Conflict of interest statement

Declaration of interests The authors declare no competing interests.

Figures

None
Graphical abstract
Figure 1
Figure 1
Overview of rodent spermatogenesis (A) Experimental design. Unselected and EpCAM-enriched mouse and rat testicular cells were encapsulated as either nuclei or whole cells for snRNA/ATAC-seq multiomic profiling (n = 6 mice and 4 rats) and CITE-seq (n = 2 mice and 9 rats), respectively. (B) UMAP projection of unselected and EpCAM+ germ cells from each assay for each species. (C) Normalized RNA expression of key genes involved in spermatogenesis. (D) Cell types assigned after unbiased clustering of integrated mouse and rat germ cells. (E) Heatmap showing gene expression for top 30 genes for each unbiased cluster. Cell type assignments are shown below cluster numbers.
Figure 2
Figure 2
Differentiation of rodent germ cells (A) UMAP projection of mouse and rat spermatogenic lineages (all panels in this figure are based on integrated RNA data from 8 mice and 13 rats). (B) Gene expression of key spermatogenesis genes by cell type. Normalized gene expression is represented by color, whereas the fraction expression of the gene within each cell type is shown (fractions below 0.2 are not shown). (C) Pearson’s correlation of mouse and rat gene expression by cell type between and within species. (D) Pseudotime for mouse and rat germ cell progression overlaid on UMAP projection. (E) Representative gene expression module showing genes with similar expression profiles across pseudotime and correlated between species (r > 0.9, Pearson’s correlation). Piwil1 expression is highlighted in magenta. Mean expression of all genes is shown by the black line. (F) Number of expressed genes (normalized expression >0.5) in each species as a scaled Venn diagram per cell type. (G) Transposable element (TE) expression by cell type for select subfamilies.
Figure 3
Figure 3
Rodent spermatogenesis involves conserved lncRNA expression and signaling pathways (A) Pathways enriched at each stage of spermatogenesis for mouse (left) and rat (right) determined using an Ingenuity Pathway Analysis based on differentially expressed genes at each stage. Z score is denoted by color and −log10p value is shown by dot size. (B) Number of expressed lncRNAs (normalized expression >0.5) in each species, matched across species using a genomic liftover, as a scaled Venn diagram per cell type. (C) Normalized expression of select lncRNAs with conserved expression patterns between species. All data in this figure were generated from integrated sn/scRNA-seq profiling (n = 8 mice and 13 rats).
Figure 4
Figure 4
Id4 and Etv5 mark distinct populations of spermatogonia in rat (A) From left to right: Gfra1 mRNA distribution in rat single-cell germ cell data (n = 13), Gfra1 mRNA localization in rat testis histology via ISH (representative image from 3 replicates; scale bar, 50 μm), GFRA1 protein distribution in rat single-cell data (n = 5), GFRA1 protein localization in rat testis histology via IHC (representative image from 3 replicates; scale bar, 50 μm). (B) Gfra1 expression counting transcripts that match individual exons (n = 9). (C) Differential gene expression between mice and rats for the undifferentiated spermatogonia across all integrated samples. Significantly different genes, including Id4, are colored. (D) Expression of Etv5 and Id4 in the early stages of mouse and rat germ cell differentiation. (E) Gfra1+Etv5+Id4 and Gfra1+Etv5Id4+ cells were observed on the basement membranes of rat seminiferous tubules visualized by in situ RNA hybridization. Dotted lines indicate estimate of cell boundaries, representative of 3 replicates. Scale bar, 10 μm. (F) Representative tubule; scale bar, 50 μm. Gfra1+ Etv5+ Id4− cell denoted by white arrow.
Figure 5
Figure 5
Chromatin accessibility in rodent spermatogenesis (A) Differentially expressed peaks specific to individual cell types across integrated ATAC datasets (mouse n = 6, rat n = 4 in all panels in this figure). Peaks are arranged along each chromosome on the x axis, with the height of each peak proportional to the log-fold change in peak accessibility. (B) Accessibility of chromatin for regions corresponding to red boxes in (A) that contain conserved genes associated with histone replacement. Gene expression for each gene is shown as violin plots. (C) Gene expression for select marker genes with matching ATAC promoter activity score in both species along pseudotime trajectory. (D) Broad-scale comparison of mouse chromosome 9 displaying average accessibility for binned genomic locations along with corresponding rat locations using genomic liftover. (E) Pearson’s correlation of gene expression and promoter activity was assessed by cell type. (F) Breakdown of differentially expressed peak genomic locations by cell type and species. (G) Pseudotime-ordered activity of four representative transcription factors active at different stages of spermatogenesis. For each TF, gene expression is shown along with accessibility of target regions and downstream gene expression aggregate. The number of associated chromatin peaks or genes in the corresponding regulon is shown in parentheses.
Figure 6
Figure 6
Chromatin, gene, and protein relationships (A and B) (A) Mouse and (B) rat Cd9 chromatin accessibility by cell type, together with Cd9 gene expression and CD9 protein as assessed by ADT (n = 2 mice, n = 2 rats). Transcription factors Klf7 and Zfp148 are predicted by GRN to associate with Cd9 in mice and rats, respectively. (C) Transplant efficiency of CD9+ mouse cells adapted from Kanatsu-Shinohara et al., 2004; n = 16 CD9+ and n = 13 control. (D) Transplant efficiency of CD9+ rat cells by MACS selection, significance assessed by Student’s t test, ∗∗p < 0.01, ∗∗∗p < 0.001, n = 4. (E and F) UMAP projection of Cd9 mRNA expression in mouse (E, n = 8) and rat (F, n = 8). (G and H) CD9 protein expression in mouse (G, n = 2) and rat (H, n = 2). (I and J) Downstream predicted enhancer accessibility in mouse (I, n = 6) and rat (J, n = 4). (K and L) Cd9 promoter accessibility in mouse (K, n = 6) and rat (L, n = 4). (M) Flow cytometric analysis of CD9 expression and gates used to sort cells. (N) Cells sorted in (M) were encapsulated and projected onto the UMAP space (n = 1). (O) mRNA and protein expression for three select spermatid-associated genes normalized by percentage of max expression (mRNA, n = 13; CD55, n = 6; SPAM1, n = 2; AIF1, n = 3). (P) Histology of PAS-stained staged sections with DAPI, Aif1 ISH, and AIF1 immunofluorescence; scale bar = 50 μm, representative image of 3 replicates shown. (Q) Spam1 expression is associated with a peak upstream of the transcriptional start site in both species matched by liftover (n = 4).
Figure 7
Figure 7
Gene regulatory analysis of rodent spermatogenesis (A) For each regulon, the proportion of shared target genes and target chromosomal regions are shown. (B) Heatmap of gene expression for 40 regulons significantly associated with spermatogenesis in both mouse and rat. Color shows gene expression of the TF by cell type, dot size indicates regulon activation as indicated by regulon specificity score. (C) For 10 selected regulons, gene regulatory network nodes are shown. Blue hexagons indicate selected TFs. Each TF’s connections to target regions have been colored with a different color. Target regions are indicated as square boxes. Connections between regions and target genes (yellow circles) are indicated in gray. A subset of target regions and genes are shown, selected by taking the top 10 gene hits for each regulon in addition to any genes from Figure 2B that were found in the selected regulons. (D) Heatmap of the gene expression of the selected genes shown by cell type. All data in this figure were generated from snRNA/ATAC-seq multiomic profiling (n = 6 mice and 4 rats).

References

    1. Barroca V., Racine C., Pays L., Fouchet P., Coureuil M., Allemand I. The netrin-1 receptor UNC5C contributes to the homeostasis of undifferentiated spermatogonia in adult mice. Stem Cell Res. 2022;60 - PubMed
    1. Boussouar F., Benahmed M. Lactate and energy metabolism in male germ cells. Trends Endocrinol. Metabol. 2004;15:345–350. - PubMed
    1. Bravo González-Blas C., De Winter S., Hulselmans G., Hecker N., Matetovici I., Christiaens V., Poovathingal S., Wouters J., Aibar S., Aerts S. SCENIC+: single-cell multiomic inference of enhancers and gene regulatory networks. Nat. Methods. 2023;20:1355–1367. - PMC - PubMed
    1. Buaas F.W., Kirsh A.L., Sharma M., McLean D.J., Morris J.L., Griswold M.D., de Rooij D.G., Braun R.E. Plzf is required in adult male germ cells for stem cell self-renewal. Nat. Genet. 2004;36:647–652. - PubMed
    1. Butler A., Hoffman P., Smibert P., Papalexi E., Satija R. Integrating single-cell transcriptomic data across different conditions, technologies, and species. Nat. Biotechnol. 2018;36:411–420. - PMC - PubMed

Publication types

LinkOut - more resources