. 2025 Mar 14;16(1):2527.
doi: 10.1038/s41467-025-57794-7.

Telomere length in offspring is determined by mitochondrial-nuclear communication at fertilization

Affiliations

Telomere length in offspring is determined by mitochondrial-nuclear communication at fertilization

Yasmyn E Winstanley et al. Nat Commun. .

Abstract

The initial setting of telomere length during early life in each individual has a major influence on lifetime risk of aging-associated diseases; however there is limited knowledge of biological signals that regulate inheritance of telomere length, and whether it is modifiable is not known. We now show that when mitochondrial activity is disrupted in mouse zygotes, via exposure to 20% O2 or rotenone, telomere elongation between the 8-cell and blastocyst stage is impaired, with shorter telomeres apparent in the pluripotent Inner Cell Mass (ICM) and persisting after organogenesis. Identical defects of elevated mtROS in zygotes followed by impaired telomere elongation, occurred with maternal obesity or advanced age. We further demonstrate that telomere elongation during ICM formation is controlled by mitochondrial-nuclear communication at fertilization. Using mitochondrially-targeted therapeutics (BGP-15, MitoQ, SS-31, metformin) we demonstrate that it is possible to modulate the preimplantation telomere resetting process and restore deficiencies in neonatal telomere length.


Conflict of interest statement

Competing interests: Y.E.W. and R.L.R. are inventors on a patent application (PCT/US23/69908) related to this work. R.L.R. is a consultant with Mitochon Technologies and Vitaleon Pharma. M.A.F. is a shareholder and consultant with N-Gene Research Laboratories Inc and is founder and shareholder of Celesta Therapeutics. H.H.S. is the inventor of SS-31 (USPTO 7,576,601; August 18, 2009). The remaining authors declare no competing interests.

Figures

Fig. 1
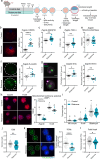
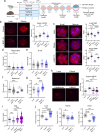
Fig. 1. Telomere elongation during pre-implantation embryogenesis is impaired by oxidative stress.
Mouse oocytes underwent in vitro fertilization (IVF) and embryos were collected at specific developmental stages at the times indicated (a) Created in BioRender. Gordon, Y. (2025) https://BioRender.com/u13t276. Telomere length (telomere/ Rn18s (2-ΔΔCt)) was measured by qPCR. Telomere length in individual oocytes/ embryos (b; n = 50 MII, n = 51 2 C, n = 57 4 C, n = 44 8 C, n = 77 blastocyst). Telomere length in dissected Inner Cell Mass (ICM) and Trophectoderm (TE) from the same blastocysts (c; n = 51). A whole blastocyst (d; upper) or isolated Inner Cell Mass (ICM) after immunosurgery (d; lower) to show purity of ICM cells (green, OCT4 + ) without TE cells (magenta, CDX2 + ). Telomere length in ICM from day 5 (D5, n = 16) and day 6 (D6, n = 21) blastocysts (e). MII oocytes were fertilized by IVF and cultured in vitro at either 5% or 20% oxygen (f) Created in BioRender. Gordon, Y. (2025) https://BioRender.com/x79j582. Telomere length in individual 8-cell embryos (g; n = 36 5% O2, n = 47 20% O2), morulae (h; n = 24 5% O2, n = 25 20% O2), and ICMs (h; n = 25 5% O2, n = 28 20% O2, i; n = 16 5% O2, n = 18 20% O2). Quantitative telomere FISH for telomere (green) with DAPI DNA stain (blue) in dissociated ICMs (j; left) and fluorescence per cell quantified (j; right; n = 271 nuclei from 30 ICMs derived from 4 mice per group, individual data points are plotted, horizontal lines are mean ± SEM). Violin plots show population distribution of telomere length, and horizontal lines are mean ± SEM (b, c, e, g-i). qPCR data was log transformed for statistical analysis. Statistical tests were: linear mixed-effects model (b); two-sided paired t-test (c), two-sided unpaired t-test (e, g, i, j); or two-way ANOVA (h). For (b) different letters indicate p < 0.05. For (c, h-j) *p < 0.02, ***p = 0.0004, ****p < 0.0001. For exact P values see Supplementary Table 1. Representative images shown, scale bar: 20 µm (d), 5 µm (j). Source data are provided as a Source Data File.
Fig. 2
Fig. 2. High oxygen culture induces mitochondrial dysfunction and zygotic epigenetic alterations.
MII oocytes were fertilized by IVF and cultured in vitro at either 5% or 20% oxygen (a) Created in BioRender. Gordon, Y. (2025) https://BioRender.com/s35n498. Zygotes (6 h post-IVF) were labelled with mitochondrial superoxide (mtROS) indicator MitoSox Red (red, plus DNA stain Hoechst-3342 (blue)) and corrected total fluorescence determined (b; n = 19/ group). Levels of NAD(P)H (c) and FAD + + (d) in zygotes 6 h post-IVF; n = 24/group. Mitochondrial mass was assessed in zygotes using MitoTracker Green (e; n = 16/group). Zygotes (4 h post-IVF), 8-cells, morulae and blastocysts were stained with mitochondrial membrane potential (MMP) indicator TMRM (red) plus Hoechst-3342 (blue) DNA stain (f; left) and fluorescence quantified (right; zygote: n = 15 5% O2, n = 18 20% O2, 8-cell: n = 13 5% O2, n = 4 20% O2, morula: n = 26 5% O2, n = 41 20% O2, blastocyst: n = 9 5% O2, n = 12 20% O2). Zygotes (8 h post-IVF) were immuno-labeled with anti-8-oxodG (green) and fluorescence intensity in the pronuclei quantified (b; n = 13 5% O2; n = 14 20% O2). Zygotes (10 h post-IVF) were immuno-labeled with anti-5-methylcytosine (5mC; magenta) and anti-5-hydroxymethylcytosine (5hmC; green) antibodies (h; left). Fluorescence intensity was measured and expressed as the ratio in paternal versus maternal pronuclei (5% O2: n = 14; 20% O2: n = 16). Individual data points are plotted, horizontal lines are mean ± SEM (b-h). Statistical tests were: two-sided unpaired t-test (b-e, g, h); or one-way ANOVA (f). For (f) different letters indicate p < 0.05. For (b-e, g, h) *p < 0.03, **p = 0.0056, ****p < 0.0001. For exact P values see Supplementary Table 2. Representative images shown, scale bar: 20 µm (b, f, g, h). Source data are provided as a Source Data File.
Fig. 3
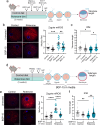
Fig. 3. Pre-conception rotenone exposure reduces fetal telomere length.
Mice were exposed to rotenone (150ppm in chow) for three weeks before mating (a), and fetal tissues collected at day 18.5 of pregnancy for assessment of telomere length. Created in BioRender. Gordon, Y. (2025) https://BioRender.com/b05w439. Relative telomere length (telomere/ Rn18s (2-ΔΔCt)) was analyzed in liver (b), kidney (c), and heart (d) of n = 33 control and n = 40 rotenone fetuses. Violin plots show population distribution, and horizontal lines are mean ± SEM. qPCR data was log transformed for statistical analysis via two-sided unpaired t-test. *p = 0.0206, **p = 0.0016. For exact P values see Supplementary Table 3. Source data are provided as a Source Data File.
Fig. 4
Fig. 4. Oocyte mitochondrial dysfunction causes pronuclear DNA modifications and reduces embryo and fetal telomere length.
Mice were exposed to rotenone (150 ppm in chow) for three weeks before ovulation, IVF and assessments of embryos and fetuses (a) Created in BioRender. Gordon, Y. (2025) https://BioRender.com/u42e503. Zygotes were labelled with MitoSox Red (red) and DNA stain Hoechst-3342 (blue) and fluorescence measured (b; n = 18 control, n = 16 rotenone). Levels of NAD(P)H (c) and FAD + + (d) in zygotes 6 h post-IVF; n = 30/group. Mitochondrial mass in zygotes was assessed using MitoTracker Green (e; n = 35 control, n = 39 rotenone). Zygotes (8 h post-IVF) were immuno-labeled with anti-8-oxodG (green) and fluorescence intensity in–– pronuclei quantified (f; n = 10 control, n = 12 rotenone). Zygotes were co-stained with anti-5-methylcytosine (5mC; magenta) and anti-5-hydroxymethylcytosine (5hmC; green) antibodies (g). Fluorescent signal intensity was quantified for 5mC (left) and 5hmC (right) in maternal and paternal pronuclei (n = 15 control, n = 12 rotenone) and presented as the ratio in paternal versus maternal pronuclei. Zygotes and 8-cell embryos were labelled with MMP indicator TMRM (red, and Hoechst-3342 (blue)) and red fluorescence measured (h; zygote: n = 20 control, n = 22 rotenone; 8-cell n = 17 control, n = 8 rotenone). Telomere length (telomere/ Rn18s (2-ΔΔCt)) in individual MII oocytes, 8-cells, blastocysts (i; MII oocyte: n = 63 control, n = 66 rotenone; 8-cell: n = 86 control, n = 61 rotenone, blastocyst: n = 45 control, n = 69 rotenone), and ICMs (j; n = 42 control, n = 38 rotenone). Quantitative telomere FISH for telomere (green) with DAPI DNA stain (blue) in dissociated ICMs (k; left) and fluorescence per cell quantified (right; n = 88 nuclei from 33 ICMs derived from 3 mice per group). IVF-conceived blastocysts from rotenone-treated (or control) mice were transferred to surrogate females for gestation, and fetal tissues collected at day 18.5 of pregnancy for qPCR telomere length analysis of heart (l; n = 36 control, n = 35 rotenone fetuses). Individual data points are plotted, horizontal lines are mean ± SEM (b-h, k). Violin plots show population distribution, and horizontal lines are mean ± SEM (i, j, l). qPCR data was log transformed for statistical analysis. Statistical tests were two-sided unpaired t-test (b-g, j-l), one-way ANOVA (h) or two-sided unpaired t-test between the same developmental stage and one-way ANOVA between different developmental stages of the same group (i). For (h, i) different letters indicate p < 0.05. For (b-g, j-l) *p < 0.05, **p ≤ 0.009, ****p < 0.0001. For exact P values see Supplementary Table 4. Representative images shown, scale bar: 20 µm (b, f, g, h), 2 µm (k). Source data are provided as a Source Data File.
Fig. 5
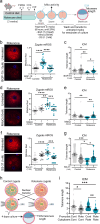
Fig. 5. BGP-15 reduces mtROS in rotenone-exposed zygotes and restores ICM telomere length.
Mice fed rotenone were treated with BGP-15 (100 mg/kg by i.p. injection, or saline vehicle) for 4 days prior to gonadotropin-stimulated ovulation and IVF (a) Created in BioRender. Gordon, Y. (2025) https://BioRender.com/d94e058. MitoSox Red (red, with DNA stain Hoechst-3342; blue) in zygotes 6 h post-fertilization (b; n = 15 control, n = 19 control+BGP-15, n = 16 rotenone, n = 20 rotenone+BGP-15). Telomere length (telomere/ Rn18s (2-ΔΔCt)) in isolated ICMs (c; n = 31 control, n = 40 control+BGP-15, n = 38 rotenone, n = 44 rotenone+BGP-15). Oocytes derived from control or rotenone-exposed females underwent in vitro fertilization in media containing 10 µM BGP-15 (+) or media with the equivalent volume of vehicle (-) (d) Created in BioRender. Gordon, Y. (2025) https://BioRender.com/t69m396. At 6 h post-fertilization, zygotes were labelled with MitoSox Red (red, and DNA stain Hoechst-3342; blue) and red fluorescence measured (e; n = 18 control, n = 15 control+BGP-15, n = 16 rotenone, n = 15 rotenone+BGP-15). Telomere length (telomere/ Rn18s (2-ΔΔCt)) in isolated ICMs (f; n = 34 control, n = 41 control +BGP-15, n = 39 rotenone, n = 53 rotenone+BGP-15). Individual data points are plotted, horizontal lines are mean ± SEM (b, e). Violin plots show population distribution, and horizontal lines are mean ± SEM (c, f). qPCR data was log transformed for statistical analysis via one-way ANOVA; *p < 0.03, **p ≤ 0.0099, ***p = 0.0006, ****p < 0.0001. For exact P values see Supplementary Table 5. Representative images shown, scale bar: 20 µm (b, e). Source data are provided as a Source Data File.
Fig. 6
Fig. 6. Mitochondria-nuclear communication at fertilization determines ICM telomere length.
Ovulated eggs from control or rotenone-exposed females underwent in vitro fertilization and embryo culture in media containing 10 µM BGP-15, 50 nM MitoQ, or 1 nM SS-31 (+) or media with the equivalent volume of vehicle (-) for 8 h and zygotes were then cultured in standard (untreated) media to the blastocyst stage (a) Created in BioRender. Gordon, Y. (2025) https://BioRender.com/y04d797. At 6 h post-fertilization, zygotes were labelled with MitoSox Red superoxide (mtROS) indicator (red, and DNA stain Hoechst-3342; blue) and red fluorescence measured (b: n = 31 control, n = 29 rotenone, n = 18 rotenone+BGP-15; d: n = 19 control, n = 13 control+MitoQ, n = 13 rotenone, n = 14 rotenone+MitoQ; f: n = 12 control, n = 12 control+SS-31, n = 16 rotenone, n = 18 rotenone+SS-31). At the blastocyst stage ICM telomere length (telomere/ Rn18s (2-ΔΔCt)) was measured by qPCR (c: n = 35 control, n = 31 control+BGP-15, n = 18 rotenone, n = 30 rotenone+BGP-15; e: n = 24 control, n = 19 control+MitoQ, n = 21 rotenone, n = 18 rotenone+MitoQ; g: n = 19 control, n = 26 control+SS-31, n = 16 rotenone, n = 19 rotenone+SS-31). Mice were exposed to rotenone (150 ppm in chow) for three weeks before hormone stimulation, mating and zygote collection. Pronuclei were transferred between zygotes derived from control (cont) or rotenone-exposed (rote) females in each possible combination, and reconstructed embryos cultured to blastocyst (h) Created in BioRender. Gordon, Y. (2025) https://BioRender.com/h97n093. ICMs from blastocysts were analyzed for telomere length (telomere/ Rn18s (2-ΔΔCt)) (i; n = 33 cont-cont, n = 24 rote-cont, n = 27 cont-rote, n = 28 rote-rote). Individual data points are plotted, horizontal lines are mean ± SEM (b, d, f). Violin plots show population distribution, and horizontal lines are mean ± SEM (c, e, g, i). qPCR data was log transformed for statistical analysis via two-way ANOVA (c, e, g) or one-way ANOVA (i), MitoSox Red analyzed via one-way ANOVA (b, d, f); *p < 0.05, **p < 0.008, ***p ≤ 0.0004, ****p < 0.0001. For exact P values see Supplementary Table 6. Representative images shown, scale bar: 20 µm (b, d, f). Source data are provided as a Source Data File.
Fig. 7
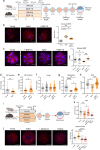
Fig. 7. Advanced maternal age impairs embryo telomere elongation that is restored by preconception treatment with mitochondria-acting therapeutics.
Female mice that were reproductively aged (12 months old) and young (3-4 months) controls were treated with BGP-15 (100 mg/kg) or saline vehicle before ovulation, IVF and embryo assessments (a) Created in BioRender. Gordon, Y. (2025) https://BioRender.com/c74d013. Zygotes were labelled with MitoSox Red (red, and Hoechst-3342 (blue)); and red fluorescence measured (b; n = 21 young, n = 12 aged, n = 10 aged+BGP-15). Morulae were stained with TMRM (red) and Hoechst-3342 (blue) and red fluorescence measured (c; n = 3 young, n = 20 young+BGP-15, n = 14 aged, n = 8 aged+BGP-15). Telomere length per cell (telomere/ Rn18s (2-ΔΔCt)) in individual MII oocytes of young vs 12-month-old mice (d; n = 108 young, n = 66 aged); as well as oocytes from 12 month old mice that were nulliparous vs multiparous (e; n = 46 nulliparous, n = 37 multiparous). Telomere length per cell in individual 8-cell embryos (f; n = 36 young, n = 33 young+BGP-15, n = 19 aged, n = 44 aged+BGP-15), whole blastocysts (g; n = 31 young, n = 10 aged, n = 24 aged+BGP-15) and isolated ICM (h; n = 12 young, n = 19 aged, n = 20 aged+BGP-15). Metformin (2 mg/mL) or MitoQ (150 µM) was administered in drinking water to reproductively aged females for two weeks prior to gonadotropin stimulation and IVF of ovulated oocytes (i) Created in BioRender. Gordon, Y. (2025) https://BioRender.com/m49j079. Zygotes were labelled with MitoSox Red (red, and Hoechst-3342 (blue)); and red fluorescence measured (j; n = 20 young, n = 31 aged, n = 21 aged+Metformin, n = 20 aged+MitoQ). Telomere length in individual ICMs (k; n = 47 young, n = 19 aged, n = 25 aged+Metformin, n = 16 aged+MitoQ). Individual data points are plotted, horizontal lines are mean ± SEM (b, c, j). Violin plots show population distribution, and horizontal lines are mean ± SEM. qPCR data was log transformed for statistical analysis. Statistical tests were one-way ANOVA (b, c, f-h, j, k) or two-sided unpaired t-test (d, e); *p < 0.05, **p ≤ 0.0095, ****p < 0.0001. For exact P values see Supplementary Table 7. Representative images shown, scale bar: 20 µm (b, c, j). Source data are provided as a Source Data File.
Fig. 8
Fig. 8. Maternal obesity impairs embryo telomere elongation that is restored by treatment with mitochondria-acting therapeutics in vitro at fertilization.
Ovulated oocytes from lean or obese mice ( > 36 g) were cultured in media containing 10 µM BGP-15 or 1 nM SS-31 (or equal volume of vehicle (-)) from fertilization (a) Created in BioRender. Gordon, Y. (2025) https://BioRender.com/w92h854. Embryos treated with 10 µM BGP-15 were analyzed for MitoSox Red (red) and Hoechst-3342 (blue) in zygotes (b; n = 23 lean, n = 15 lean +BGP-15, n = 21 obese, n = 17 obese +BGP-15), TMRM (red) and Hoechst-3342 (blue) in morulae (c; n = 18 lean, n = 17 obese, n = 18 obese +BGP-15), and telomere length (telomere/ Rn18s (2-ΔΔCt)) in ICM (d; n = 43 lean, n = 32 lean +BGP-15, n = 24 obese, n = 30 obese +BGP-15). Embryos treated with 1 nM SS-31 were analyzed for MitoSox Red (red) and Hoechst-3342 (blue) in zygotes (e; n = 15 lean, n = 12 lean +SS-31, n = 15 obese, n = 18 obese +SS-31) and telomere length (telomere/ Rn18s (2-ΔΔCt)) in ICM (f; n = 29 lean, n = 29 lean +SS-31, n = 31 obese, n = 40 obese +SS-31). Individual data points are plotted, horizontal lines are mean ± SEM (b, c, e). Violin plots show population distribution, and horizontal lines are mean ± SEM (d, Ff). qPCR data was log transformed for statistical analysis. Data analyzed using one-way ANOVA; *p < 0.05, **p = 0.0013, ***p ≤ 0.0009, ****p < 0.0001. For exact P values see Supplementary Table 8. Source data are provided as a Source Data File.
Fig. 9
Fig. 9. Maternal obesity impairs embryo and fetal telomere elongation that is restored by pre-conception treatment with mitochondria-acting therapeutics.
Obese female mice ( > 36 g) and lean littermate controls were treated with BGP-15 (100 mg/kg) or saline vehicle prior to ovulation, IVF and analysis of embryos and fetal tissues (a) Created in BioRender. Gordon, Y. (2025) https://BioRender.com/z87s922. Zygotes were labelled with MitoSox Red (red) and Hoechst-3342 (blue) and red fluorescence measured (b; n = 12 lean, n = 11 lean+BGP-15, n = 17 obese, n = 10 obese+BGP-15). 8-cell embryos and morulae were stained with TMRM (red) and Hoechst-3342 (blue) and red fluorescence measured (c; 8-cell: n = 28 lean, n = 23 lean+BGP-15, n = 17 obese, n = 14 obese+BGP-15; morula: n = 11 lean, n = 17 lean+BGP-15, n = 10 obese, n = 7 obese+BGP-15). Telomere length per cell (telomere/ Rn18s (2-ΔΔCt)) was assessed by qPCR in individual MII oocytes (d; n = 250 lean, n = 218 lean+BGP-15, n = 104 obese, n = 100 obese+BGP-15), 8-cell embryos (e; n = 30 lean, n = 50 lean+BGP-15, n = 22 obese, n = 45 obese+BGP-15), whole blastocysts (f; n = 51 lean, n = 16 lean+BGP-15, n = 11 obese, n = 12 obese+BGP-15) and ICM (g; n = 31 lean, n = 24 obese, n = 17 obese+BGP-15). Metformin (2 mg/mL) or MitoQ (150 µM) was administered in drinking water to obese females for two weeks prior to gonadotropin stimulation and IVF of ovulated oocytes. Zygotes were labelled with MitoSox Red (red) and Hoechst-3342 (blue); and red fluorescence measured (h; n = 21 lean, n = 16 obese, n = 19 obese+Metformin, n = 23 obese+MitoQ). Telomere length in individual ICMs (i; n = 57 lean, n = 45 obese, n = 36 obese+Metformin, n = 37 obese+MitoQ). Blastocysts from oocytes of lean, obese, or obese BGP-15-treated (100 mg/kg) mice were transferred to surrogate females for gestation and fetal tissues collected at day 14.5 of pregnancy for qPCR telomere length analysis (telomere/36b4 (2-ΔΔCt)) of liver, kidney, and heart (j; liver: n = 16 lean, n = 17 obese, n = 12 obese+BGP-15; kidney: n = 12 lean, n = 12 obese, n = 10 obese+BGP-15, heart: n = 6 lean, n = 12 obese, n = 11 obese+BGP-15). Individual data points are plotted, horizontal lines are mean ± SEM (b, c, h). Violin plots show population distribution, and horizontal lines are mean ± SEM (d-g, i, j). qPCR data was log transformed for statistical analysis. Data analyzed using one-way ANOVA; *p < 0.05, **p < 0.009, ***p ≤ 0.0007, ****p < 0.0001. For exact P values see Supplementary Table 9. Source data are provided as a Source Data File.

References

    1. Blackburn, E. H., Epel, E. S. & Lin, J. Human telomere biology: A contributory and interactive factor in aging, disease risks, and protection. Science (N. Y., NY)350, 1193–1198 (2015). - PubMed
    1. D’Mello, M. J. et al. Association between shortened leukocyte telomere length and cardiometabolic outcomes: systematic review and meta-analysis. Circ. Cardiovasc Genet.668, 82–90 (2015). - PubMed
    1. Schneider, C. V. et al. Association of Telomere Length With Risk of Disease and Mortality. JAMA Intern Med.182, 291–300 (2022). - PMC - PubMed
    1. Entringer S., de Punder K., Buss C., Wadhwa P. D. The fetal programming of telomere biology hypothesis: an update. Philosophical Transactions of the Royal Society of London Series B, Biological Sciences 373, (2018). - PMC - PubMed
    1. Martens, D. S., Plusquin, M., Gyselaers, W., De Vivo, I. & Nawrot, T. S. Maternal pre-pregnancy body mass index and newborn telomere length. BMC Med.14, 148 (2016). - PMC - PubMed

MeSH terms

LinkOut - more resources