. 2025 Mar 14;16(1):2531.
doi: 10.1038/s41467-025-57926-z.

Expression of ENL YEATS domain tumor mutations in nephrogenic or stromal lineage impairs kidney development

Affiliations

Expression of ENL YEATS domain tumor mutations in nephrogenic or stromal lineage impairs kidney development

Zhaoyu Xue et al. Nat Commun. .

Abstract

Recurrent gain-of-function mutations in the histone reader protein ENL have been identified in Wilms tumor, the most prevalent pediatric kidney cancer. However, their pathological significance in kidney development and tumorigenesis in vivo remains elusive. Here, we generate mouse models mimicking ENL tumor (ENLT) mutations and show that heterozygous mutant expression in Six2+ nephrogenic or Foxd1+ stromal lineages leads to severe, lineage-specific kidney defects, both resulting in neonatal lethality. Six2-ENLT mutant kidneys display compromised cap mesenchyme, scant nephron tubules, and cystic glomeruli, indicative of premature progenitor commitment and blocked differentiation. Bulk and spatial transcriptomic analyses reveal aberrant activation of Hox and Wnt signaling genes in mutant nephrogenic cells. In contrast, Foxd1-ENLT mutant kidneys exhibit expansion in renal capsule and cap mesenchyme, with dysregulated stromal gene expression affecting stroma-epithelium crosstalk. Our findings uncover distinct pathways through which ENL mutations disrupt nephrogenesis, providing a foundation for further investigations into their role in tumorigenesis.


Conflict of interest statement

Competing interests: The authors declare no competing interests.

Figures
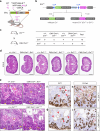
Fig. 1
Fig. 1. Generation of conditional knock-in (cKI) EnlT-fl mouse models.
a Schematic of ENLT1 (T1) and ENLT3 (T3) mutations in mouse models. IDR, intrinsic disordered region; AHD, ANC-1 homology domain. Created in BioRender. Wen, H. (2025) https://BioRender.com/w38y497. b Schematic of cKI allele of EnlT1 or EnlT3. c Lethality induced by the expression of ENLT mutants driven by CMV-Cretg. Schematic of the breeding strategy on the left. The table lists the numbers of viable progeny with all expected genotypes. d Hematoxylin and eosin (H&E) staining of kidney sections from E18.5 embryos with indicated genotypes. Scale bars, 0.5 mm. e Zoomed-in images of H&E-stained sections showing histological changes observed in ENLT1 mutant kidney at E18.5. CM cap mesenchyme, G glomerulus, PT proximal tubule, RV renal vesicle, S S-shaped body, UB ureteric bud. f, g Immunostaining for WT1 of E18.5 kidney sections from EnlT1-fl/+ (f) and CMV-Cretg/+; EnlT1-fl/+ (g) embryos. Solid red arrowheads indicate developing glomeruli at various stages. h, i Immunostaining for E-Cadherin (E-Cad) of E18.5 kidney sections from EnlT1-fl/+ (h) and CMV-Cretg/+; EnlT1-fl/+ (i) embryos. Red open triangles indicate proximal tubules with light E-Cad staining. Scale bars in ei, 50 μm. For (di), similar results were obtained in three independent experiments.
Fig. 2
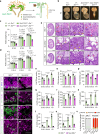
Fig. 2. Induced ENLT1 mutant expression in nephron progenitors impedes embryonic kidney development.
a Schematic of Six2-TGCtg expression in nephrogenesis. Six2+ cells and nephron derivatives are highlighted in green. DT distal tubule, LOH loop of Henle, PT proximal tubule. Created in BioRender. Wen, H. (2025) https://BioRender.com/g02w127. b Bright-field images of P0 kidneys with indicated genotypes. Scale bars, 1 mm. c, d Kidney weight (c) and size (d). Sample numbers at E16.5, E18.5 and P0: +/+; Enl+/+ (n = 10, 12, 12); +/+; EnlT1-fl/+ (n = 12, 12, 12); Six2-TGCtg/+; Enl+/+ (n = 12, 10, 12); and Six2-TGCtg/+; EnlT1-fl/+ (n = 12, 6, 8). e H&E staining of ENLWT (Six2-TGCtg/+; Enl+/+), Six2-ENLT1 and Six2-ENLT3 P0 kidney sections. Solid line boxes are magnified, highlighting the nephrogenic zone (NGZ), and dash line boxes are magnified, focusing on glomerulus and PT. Red arrowheads indicate glomeruli; red open triangles indicate PT; and black triangles indicate cap mesenchyme (CM). C comma-shaped body, RV renal vesicle, S S-shaped body, UB ureteric bud. Scale bars: 0.5 mm (first column), 0.1 mm (second column), and 50 μm (last two zoom-in columns). fm Immunofluorescence staining of SIX2 and KRT8 (f, g), WT1 and NCAM (h, i), LTL and E-Cad (j, k), and SLC12A3 and E-Cad (l, m) in P0 kidney sections. Scale bars, 100 μm. nu Quantification of nephron structures per section. CM numbers (n) and thickness (o) (n = 6, 8, 6 ENLWT and 7, 6, 6 ENLT1); NGZ thickness (p) (n = 8, 8, 8 ENLWT and 8, 8, 6 ENLT1); numbers of RV (q) and CSB-SSB (r) (n = 6, 12, 7 ENLWT and 6, 14, 8 ENLT1), PT (s) (n = 6, 6, 6 ENLWT and 6, 6, 8 ENLT1), DT (t) (n = 8, 6, 8 ENLWT and 6, 8, 8 ENLT1) and glomeruli (u) (n = 8, 8, 8 ENLWT and 6, 10, 8 ENLT1). v Percentage of glomeruli with normal, abnormal and cystic morphologies in the same set of ENLWT and Six2-ENLT1 kidneys as in (u). Data represent mean ± s.d.; two-tailed unpaired t-test. Source data are provided as a Source Data file.
Fig. 3
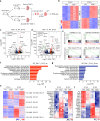
Fig. 3. Gene expression changes in sorted ENLT1 mutant cells from E14.5 and E18.5 Six2-ENLT1 kidneys.
a Schematic of the mouse mating strategy and experimental design. Created in BioRender. Wen, H. (2025) https://BioRender.com/l62o789. b Heatmap representation of differentially expressed genes (DEGs) in sorted tdTomato+ (tdT+) cells from WT and Six2-ENLT1 embryonic kidneys at E14.5 and E18.5 (n = 3). c, d Volcano plots of all expressed genes in the sorted tdT+ kidney cells from E14.5 (c) and E18.5 (d) kidneys. The x-axis is the log2 fold change (log2FC) of counts per million (CPM) values from ENLT1 vs. WT. The y-axis is −log10 transformed FDR (log10FDR) values of each gene. Hox genes and key marker genes of nephron progenitor, podocyte, and proximal tubule are highlighted in red, blue, green, and pink, respectively. e GSEA plots with tdT+ Six2-ENLT1 vs. tdT+ WT kidney cells at E14.5 as ranking list and the indicated curated gene lists or GO term as gene sets. Positive enrichment scores are highlighted in red, while negative enrichment scores are in blue. f, g Enriched GO terms of the up (f) and down (g) DEGs identified in tdT+ Six2-ENLT1 cells at E14.5. The top ten GO biological process terms with FDR <0.05 are shown. h Heatmap of 3187 DEGs in sorted Six2-ENLT1 cells from E14.5 and E18.5 kidneys grouped into six clusters. C1, upregulated at both E14.5 and E18.5; C2, upregulated at E14.5 only; C3, upregulated at E18.5 only; C4, downregulated at E14.5 only; C5, downregulated at E18.5 only; and C6, downregulated at both E14.5 and E18.5. Numbers of DEGs in each cluster are shown in parenthesis. i, j Heatmaps of key nephrogenesis genes in clusters C1 (i) and C6 (j). Color keys represent Z-score log2CPM in b, hj.
Fig. 4
Fig. 4. Spatial transcriptomic analysis of gene expression changes in Six2-ENLT1 mutants.
a Spatial distribution of annotated cell types and renal structures mapped to the H&E tissue section images. Areas outlined in the whole kidney images are enlarged in the zoom-in images on the right. NP nephron progenitor, SSB S-shaped body, PT proximal tubule, CnS connecting segment, DT distal tubule, and LOH loop of Henle. Images are representative of four pairs of kidney sections in the spatial transcriptomic analysis. Scale bars: 0.5 mm (whole kidney), and 0.1 mm (zoom-in). b Percentage of bins with annotated cell types as in (a) in WT and ENLT1 tissue samples. Two-tailed Chi-square test. c Bubble plot showing enriched GO biological process terms for the upregulated (red) and downregulated (blue) DEGs in NP, committing NP, and SSB segments of Six2-ENLT1 kidney sections. Color key represents −log10FDR values. Bubble size denotes gene counts. Black-circled bubbles indicate GO terms with FDR <0.05. d Heatmap of metanephros developmental genes across nephron cell types for DEGs identified in Six2-ENLT1 NP, committing NP and SSB. The color key represents the log2FC of ENLT1 vs. WT. DEGs with FDR <0.05 are marked with stars. e Violin plot showing expression levels (log normalized counts) of Hoxd11, Wnt4, Six2, and Igf2 in NP, committing NP and SSB segments of WT and ENLT1 samples. Wald test with adjusted P values shown; ns not significant. f Expression and spatial distribution of Hoxd11, Wnt4, and Six2 in WT and ENLT1 kidney sections. The color key represents log2 transformed UMI counts (log2Exp) in bins. n = 4 WT and 4 ENLT1. Scale bars, 0.1 mm. g Schematic model illustrating how ENLT mutations in the nephron lineage impair nephrogenesis.
Fig. 5
Fig. 5. Expression of ENLT1 mutant in stromal compartment impairs nephrogenesis.
a Schematic of Foxd1GC expression in nephrogenesis and cell types derived from Foxd1+ stromal progenitors. b Kidney weight and size. Sample sizes: E16.5, n = 10 ENLWT and 8 ENLT1; E18.5, n = 10 ENLWT and 8 ENLT1; and P0, n = 10 ENLWT and 10 ENLT1. c, H&E staining of kidney sections from P0 ENLWT and Foxd1-ENLT1 pups. Solid line boxes are magnified, focusing on the NGZ, and dash line boxes are magnified, focusing on glomeruli and PT. Red arrowheads indicate glomeruli; black open triangles indicate PT; and black triangles indicate capsular stroma. Scale bars: 0.5 mm (first column), 0.1 mm (second column), and 50 μm (last two zoom-in columns). dm Immunofluorescence staining of SIX2 and KRT8 (d, e), WT1 and NCAM (f, g), TENASCIN (h, i), LTL and E-Cad (j, k), and SLC12A3 and E-Cad (l, m) in E18.5 kidney sections. Scale bars, 100 μm. nu Quantification of nephron structures per section. Capsular stroma thickness (n) (n = 8, 6, 8 ENLWT and 8, 6, 6 ENLT1); CM number (o) (n = 12, 8, 6 ENLWT and 12, 8, 6 ENLT1); CM thickness (p) (n = 12, 8, 8 ENLWT and 12, 8, 6 ENLT1); numbers of RV (q) and CSB-SSB (r) (n = 7, 6, 8 ENLWT and 8, 6, 6 ENLT1), PT (s) (n = 6, 12, 12 ENLWT and 10, 12, 7 ENLT1), DT (t) (n = 10, 8, 8 ENLWT and 8, 8, 8 ENLT1), and glomeruli (u) (n = 8 per sample group per time point). v Percentage of glomeruli with normal, abnormal, and cystic morphologies in the same set of ENLWT and Foxd1-ENLT1 kidneys as in (u). Data represent mean ± s.d.; two-tailed unpaired t-test; ns not significant. w Immunohistochemistry staining of Ki-67 in E18.5 ENLWT and Foxd1-ENLT1 kidney sections. Scale bars, 50 μm. x Immunofluorescence staining of PDGFRB and PODXL in glomeruli of P0 kidneys. Scale bars, 40 μm. For (w, x), similar results were obtained in three independent experiments. Source data are provided as a Source Data file.
Fig. 6
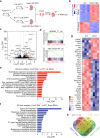
Fig. 6. Gene expression changes in sorted ENLT1 mutant stromal cells from E18.5 Foxd1-ENLT1 kidneys.
a Schematic of the mouse mating strategy and experimental design. Created in BioRender. Wen, H. (2025) https://BioRender.com/l62o789. b Heatmap representation of differentially expressed genes (DEGs) in sorted tdTomato+ (tdT+) cells from WT and Foxd1-ENLT1 embryonic kidneys at E18.5 (n = 4). c Volcano plots of all expressed genes in the sorted tdT+ stromal cells from E18.5 kidneys. The x-axis is the log2FC of CPM values from ENLT1 vs. WT. The y-axis is −log10 transformed FDR values of each gene. Representative Hox genes and genes upregulated in human Wilms tumors with ENLT mutations are highlighted in red, and downregulated stromal genes are highlighted in blue. d GSEA plots with tdT+ Foxd1-ENLT1 vs. tdT+ WT kidney stroma cells as ranking list and the indicated curated gene lists as gene sets. e, f Enriched GO terms (FDR <0.05) of upregulated (e) and downregulated (f) DEGs in tdT+ Foxd1-ENLT1 cells. g Heatmap of stroma marker genes differentially expressed in sorted tdT+ WT and Foxd1-ENLT1 cells. The color key represents Z-score log2CPM. h Venn diagram of overlapping DEGs in Six2-ENLT1 nephron cells and Foxd1-ENLT1 stroma cells from E18.5 kidneys.
Fig. 7
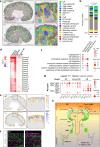
Fig. 7. Spatial transcriptomic analysis of gene expression changes in Foxd1-ENLT1 mutants.
a Spatial distribution of annotated cell types and renal structures mapped to the H&E tissue section images. Areas outlined in the whole kidney images are enlarged in the zoom-in images on the right. NP nephron progenitor, SSB S-shaped body, PT proximal tubule, CnS connecting segment, DT distal tubule, and LOH loop of Henle. Images are representative of two pairs of kidney sections in the spatial transcriptomic analysis. Scale bars: 0.5 mm (whole kidney), and 0.1 mm (zoom-in). b Percentage of bins with annotated cell types as in (a) in WT and ENLT1 tissue samples. Two-tailed Chi-square test. c Bubble plot showing enriched GO biological process terms for upregulated DEGs in the capsular, cortical, and medullary stroma of Foxd1-ENLT1 kidney sections. Color key represents −log10FDR values. Bubble size denotes gene counts. Black-circled bubbles indicate GO terms with FDR <0.05. d Heatmap representation of Hox gene expression changes across stroma, NP, committing NP, and UB clusters in Foxd1-ENLT1 samples. The color key represents the log2FC of ENLT1 vs. WT. DEGs with FDR <0.05 are marked with stars. e Spatial expression and distribution of Fn1 in nephrogenic zone stroma and Itga8 in NP/committing NP clusters in WT and ENLT1 tissue samples. The color key represents log normalized counts. f Immunofluorescence staining of FN and ITGA8 in E18.5 WT and Foxd1-ENLT1 kidney sections. Results are representative of three independent experiments. Scale bar, 100 μm. g Bubble plot depicting the strength and specificity of paracrine ligand-receptor interactions between capsular stroma Fn1 and its engaged receptors in NP, committing NP, and UB in WT and ENLT1 samples. The color key represents log magnitude P values. Bubble size denotes log specificity P values. Robust rank aggregation was used for P value calculation. h Schematic model illustrating how ENLT mutations in the stromal lineage impair nephrogenesis.

References

    1. Costantini, F. & Kopan, R. Patterning a complex organ: branching morphogenesis and nephron segmentation in kidney development. Dev. Cell18, 698–712 (2010). - PMC - PubMed
    1. Dressler, G. R. Patterning and early cell lineage decisions in the developing kidney: the role of Pax genes. Pediatr. Nephrol.26, 1387–1394 (2011). - PMC - PubMed
    1. Dressler, G. R. Advances in early kidney specification, development and patterning. Development136, 3863–3874 (2009). - PMC - PubMed
    1. Kobayashi, A. et al. Six2 defines and regulates a multipotent self-renewing nephron progenitor population throughout mammalian kidney development. Cell Stem Cell3, 169–181 (2008). - PMC - PubMed
    1. Pleniceanu, O., Harari-Steinberg, O. & Dekel, B. Concise review: kidney stem/progenitor cells: differentiate, sort out, or reprogram? Stem Cells28, 1649–1660 (2010). - PMC - PubMed

MeSH terms

LinkOut - more resources