. 2025 Mar 14;13(1):36.
doi: 10.1038/s41413-025-00413-4.

SIRT3-PINK1-PKM2 axis prevents osteoarthritis via mitochondrial renewal and metabolic switch

Affiliations

SIRT3-PINK1-PKM2 axis prevents osteoarthritis via mitochondrial renewal and metabolic switch

Yaoge Deng et al. Bone Res. .

Abstract

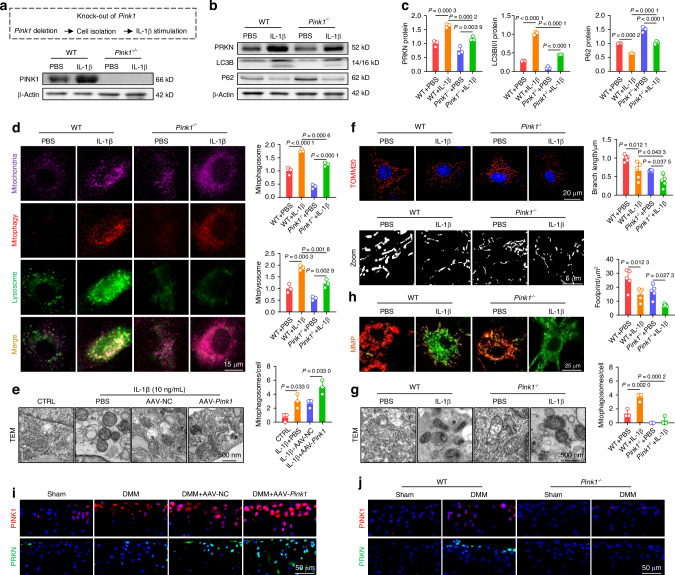
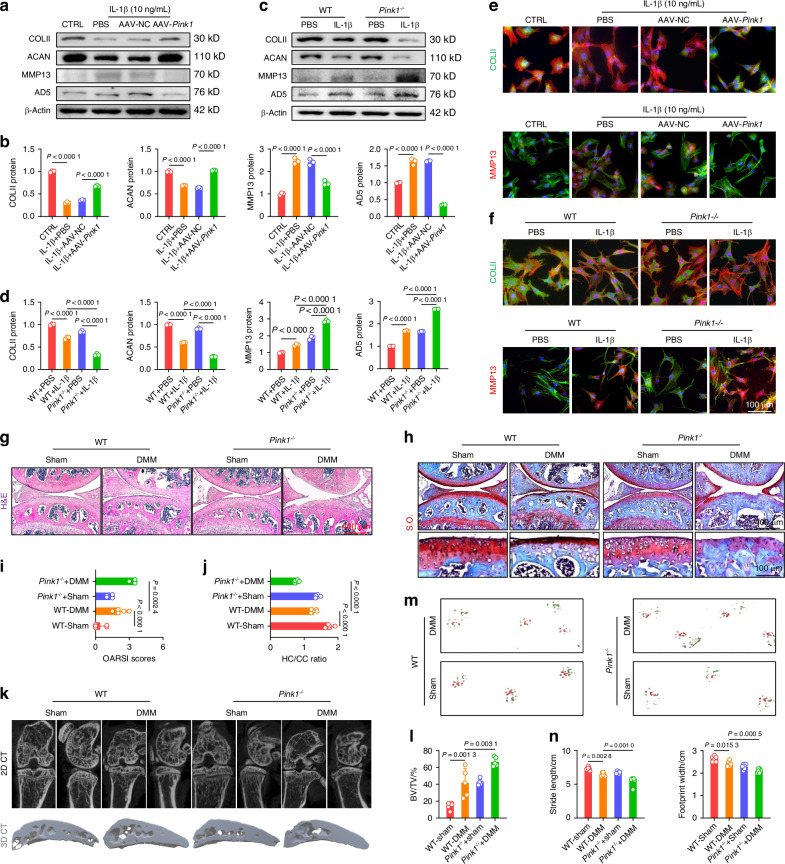
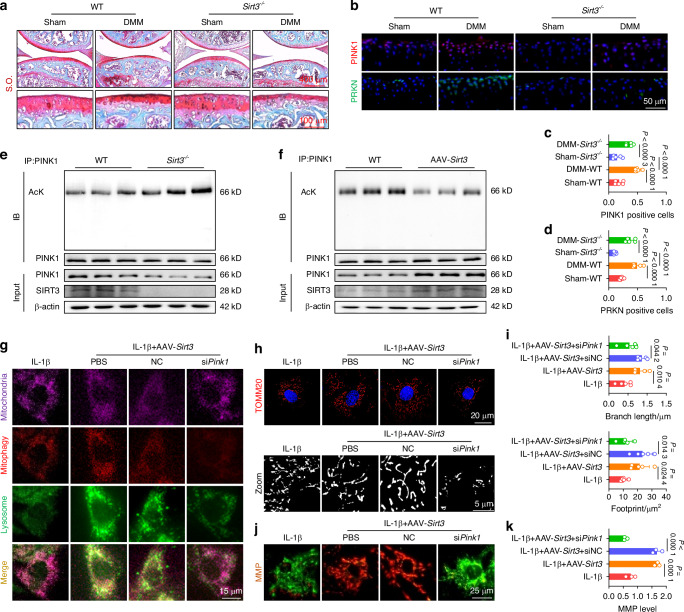
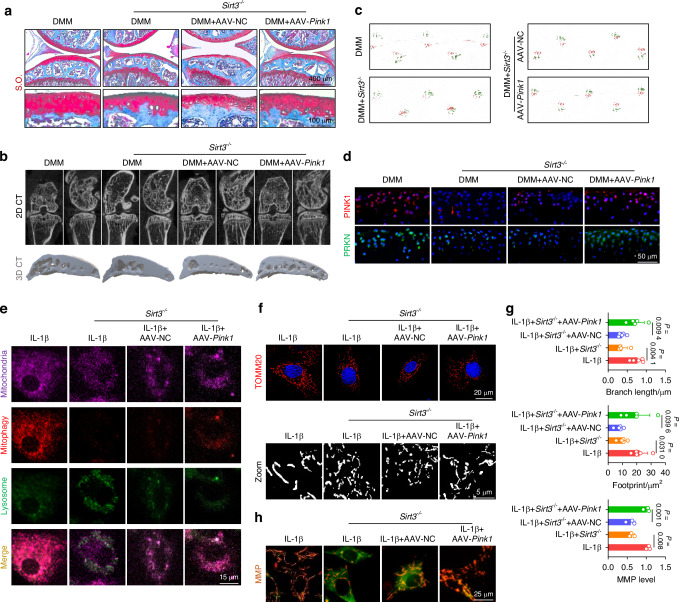
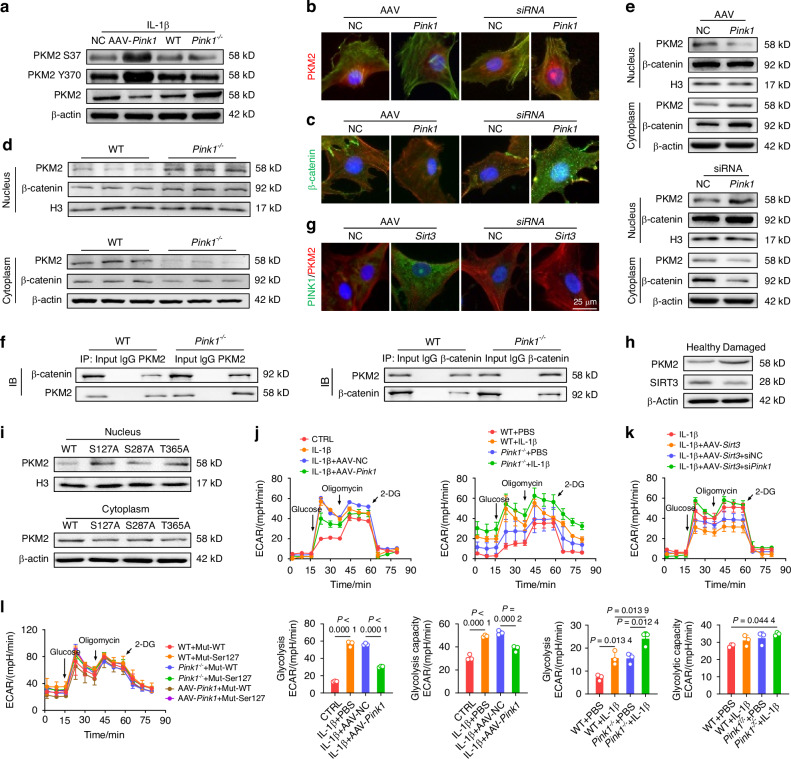
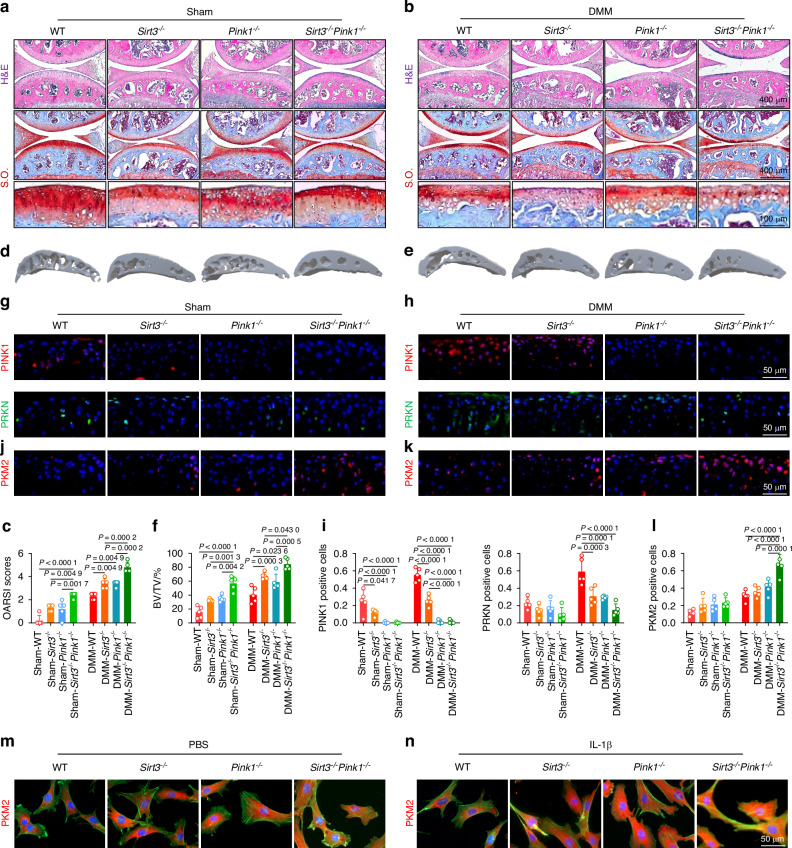
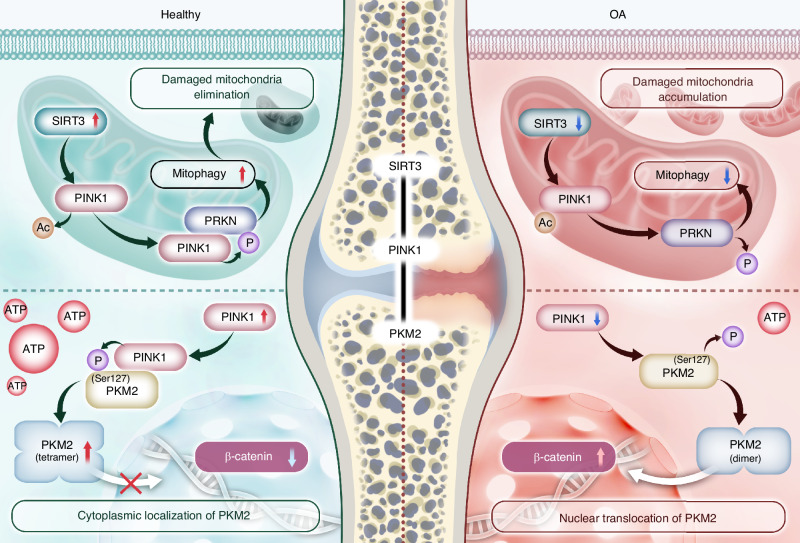
Maintaining mitochondrial homeostasis is critical for preserving chondrocyte physiological conditions and increasing resistance against osteoarthritis (OA). However, the underlying mechanisms governing mitochondrial self-renewal and energy production remain elusive. In this study, we demonstrated mitochondrial damage and aberrant mitophagy in OA chondrocytes. Genetically overexpressing PTEN-induced putative kinase 1 (PINK1) protects against cartilage degeneration by removing defective mitochondria. PINK1 knockout aggravated cartilage damage due to impaired mitophagy. SIRT3 directly deacetylated PINK1 to promote mitophagy and cartilage anabolism. Specifically, PINK1 phosphorylated PKM2 at the Ser127 site, preserving its active tetrameric form. This inhibited nuclear translocation and the interaction with β-catenin, resulting in a metabolic shift and increased energy production. Finally, a double-knockout mouse model demonstrated the role of the SIRT3-PINK1-PKM2 axis in safeguarding the structural integrity of articular joints and improving motor functions. Overall, this study provides a novel insight into the regulation of mitochondrial renewal and metabolic switches in OA.


Conflict of interest statement

Competing interests: The authors declare no competing interests.

Figures

Fig. 1
Fig. 1
Mitochondrial damage and maladaptive mitophagy were implicated in OA progression. a Chondrocytes were treated with interleukin-1β (IL-1β) at varying concentrations and stained for translocase of outer mitochondrial membrane 20 (TOMM20) to measure mitochondrial branch length and footprint. Images were captured using a 100x, 1.5 NA oil immersion objective on the highly intelligent and sensitive SIM (HIS-SIM) system and subsequently processed with Wiener deconvolution. Quantification of the branch length and footprint of mitochondria was performed with mitochondrial network analysis (MiNA) toolset (n = 5). b Mitochondrial membrane potential (MMP) assessed using JC-1 staining and fluorescence microscopy in IL-1β-treated chondrocytes (n = 3). c Analysis of the representative fluorescence of mitoROS in IL-1β-treated chondrocytes (n = 3). d Co-staining of mitochondria and PINK1 using immunofluorescence (n = 3). e Evaluation of LC3B and lysosome colocalization in IL-1β-treated chondrocytes (n = 3). f Analyses of mitochondria, mitophagosomes, and lysosome colocalization in IL-1β-treated chondrocytes (n = 3). g, h Hematoxylin and eosin (H&E) and Safranin O (S.O.) staining of Sham and destabilization of the medial meniscus (DMM) mice at 4, 8, and 12 weeks post-surgery. i In vivo representative images of IL-1β-positive chondrocytes via immunofluorescence in Sham and DMM mice. j In vivo immunofluorescence representative images of PINK1- and PRKN-positive chondrocytes in Sham and DMM mice. The values represent mean ± standard deviation (SD). Statistically significant differences are indicated by P < 0.05 between the indicated groups
Fig. 2
Fig. 2
Targeting PINK1 activated mitophagy to eliminate defective mitochondria and facilitate mitochondrial self-renewal. a Protein levels confirm Pink1 knockout in mice. b, c Pink1 depletion downregulates proteins involved in the mitophagy pathway (n = 3). d Mitophagy fluorescence indicates reduced mitophagy activity following Pink1 deficiency (n = 3). e Transmission electron microscopy (TEM) images of mouse chondrocytes following Pink1 overexpression (n = 3). f Mitochondrial branch length and footprint measurement via TOMM20 immunofluorescence post-Pink1 deficiency (n = 5). g TEM images of mouse chondrocytes following Pink1 deletion (n = 3). h MMP changes following Pink1 deficiency (n = 3). i Increased cells positive for PINK1-PRKN axis-related proteins following AAV-mediated Pink1 overexpression in the joint cavity. j Decreased cells positive for PINK1-PRKN axis-related proteins following Pink1 knockout. The values represent mean ± SD. Statistically significant differences are indicated by P < 0.05 between the indicated groups
Fig. 3
Fig. 3
Genetic overexpression or global knockout of Pink1 impacted cartilage homeostasis and OA development. a, b Western blot analysis of COLII, ACAN, MMP13, and ADAMTS5 protein levels following Pink1 overexpression (n = 3). c, d Western blot analysis of COLII, ACAN, MMP13, and ADAMTS5 protein levels following Pink1 deficiency (n = 3). e, f Cellular immunofluorescence for COLII or MMP13 in the context of Pink1 overexpression and deficiency, respectively. g, h Representative images of H&E and S.O. staining following Pink1 knockout. i, j Quantitative analysis of osteoarthritis research society international (OARSI) scores and the ratio of hyaline cartilage (HC) to calcified cartilage (CC) (n = 5). k Micro-computed tomography (μ-CT) imaging analyses comparing wild-type and Pink1-knockout (Pink1–/–) mice before and after surgery. l Quantitative analysis of trabecular bone volume fraction (BV/TV) of wild-type and Pink1–/– mice (n = 5). m, n Gait analysis and quantification of stride length and footprint width of wild-type and Pink1–/– mice (n = 6). The values represent mean ± SD. Statistically significant differences are indicated by P < 0.05 between the indicated groups
Fig. 4
Fig. 4
SIRT3-PINK1 axis activated mitophagy and cartilage anabolism via deacetylation to counteract OA. a S.O. staining in Sirt3-knockout (Sirt3–/–) mice. bd Representative images and quantification of PINK1- or PRKN-positive chondrocytes in vivo for wild-type and Sirt3–/– mice (n = 5). e Detection of total protein content and acetylation level of PINK1 in wild-type and Sirt3-deficient chondrocytes using co-immunoprecipitation (Co-IP) assay. f Detection of total protein content and acetylation level of PINK1 in wild-type and Sirt3-overexpressing chondrocytes using Co-IP assay. g SIRT3-induced mitophagy is reduced by siPink1 transfection. h, i Impaired SIRT3-mediated mitochondrial length and footprint improvements following siPink1 transfection (n = 5). j, k Impaired SIRT3-mediated MMP improvements following siPink1 transfection (n = 3). The values represent mean ± SD. Statistically significant differences are indicated by P < 0.05 between the indicated groups
Fig. 5
Fig. 5
Overexpression of Pink1 ameliorated the decrement in mitophagy engendered by Sirt3 knockout to impede the progression of OA. a S.O. staining in Sirt3-knockout (Sirt3–/–) mice following AAV-mediated Pink1 overexpression. b μ-CT imaging analysis comparing Sirt3–/– mice before and after overexpression of Pink1. c Gait analysis of Sirt3–/– mice before and after overexpression of Pink1. d In vivo immunofluorescence representative images of PINK1- or PRKN-positive chondrocytes for Sirt3–/– mice before and after overexpression of Pink1. e SIRT3-induced mitophagy is rescued by overexpression of Pink1. fg Mitochondrial length and footprint measurement via TOMM20 immunofluorescence in Sirt3 knockout cells following the overexpression of Pink1 (n = 5). h MMP changes in Sirt3 knockout cells following the overexpression of Pink1 (n = 3). The values represent mean ± SD. Statistically significant differences are indicated by P < 0.05 between the indicated groups
Fig. 6
Fig. 6
PINK1 directly phosphorylated PKM2 and inhibited its nuclear translocation to promote energy production. a Impact of Pink1 deletion and overexpression on PKM2 protein levels and phosphorylation at Tyr370 and Ser37. b, c Immunofluorescence assessment of PKM2 and β-catenin nuclear translocation following PINK1 modulation. d Quantitative analysis of PKM2 protein distribution in wild-type and Pink1–/– mice using nucleocytoplasmic fractionation. e Assessment of the nuclear-cytoplasmic distribution of PKM2 and β-catenin upon PINK1 overexpression and siPink1 treatment. f Interaction between PKM2 and β-catenin after Pink1 knockout using Co-IP assay. g Observation of colocalization of PKM2 and PINK1 following overexpression or knockdown of Sirt3. h Protein levels of PKM2 and SIRT3 in healthy or damaged cartilage tissues from OA patients. i Analysis of the impacts of PKM2 mutations at three phosphorylation sites (Ser127, Ser287, and Thr365) on its subcellular distribution through nucleocytoplasmic fractionation. j Extracellular acidification rate (ECAR) analysis following Pink1 overexpression or knockout (n = 3). k ECAR analysis following Sirt3 overexpression and subsequent siPink1 transfection (n = 3). l Effect of PKM2 mutation at the Ser127 phosphorylation site on ECAR Levels in wild-type, PINK1-overexpressing, and PINK1-deficient chondrocytes (n = 3). The values represent mean ± SD. Statistically significant differences are indicated by P < 0.05 between the indicated groups
Fig. 7
Fig. 7
Double-knockout of Sirt3 and Pink1 in vivo aggravated cartilage-bone degeneration and motor function impairment. ac H&E and S.O. staining in Sirt3–/– Pink1–/– mice compared with wild-type, Sirt3–/–, and Pink1–/– mice before and after surgery (n = 5). df μ-CT imaging analyses in Sirt3–/– Pink1–/– mice compared with wild-type, Sirt3–/–, and Pink1–/– mice before and after surgery (n = 5). gl In vivo Immunofluorescence representative images of PINK1-, PRKN-, or PKM2-positive chondrocytes in Sirt3–/– Pink1–/– double-knockout mice before and after surgery compared with other genotypes within the same experimental group (n = 5). m, n Representative immunofluorescence microscopy images illustrating PKM2 nuclear translocation in chondrocytes derived from Sirt3–/– Pink1–/– mice compared with wild-type, Sirt3–/–, and Pink1–/– mice before and after IL-1β treatment. The values represent mean ± SD. Statistically significant differences are indicated by P < 0.05 between the indicated groups
Fig. 8
Fig. 8
An overview of the regulatory mechanisms of SIRT3-PINK1-PKM2 in OA pathogenesis. SIRT3 directly deacetylates PINK1, enhancing its activities. Subsequently, PRKN is recruited and initiates mitophagy flux to eliminate damaged mitochondria. Additionally, PINK1 directly phosphorylates PKM2 at the Ser127 site to preserve its tetrameric conformation and prevent nuclear translocation, thereby facilitating the metabolic shift toward efficient energy production

References

    1. DeMoya, C. D. et al. Advances in viscosupplementation and tribosupplementation for early-stage osteoarthritis therapy. Nat. Rev. Rheumatol.20, 432–451 (2024). - PMC - PubMed
    1. Durán-Sotuela, A. et al. A meta-analysis and a functional study support the influence of mtDNA variant m.16519C on the risk of rapid progression of knee osteoarthritis. Ann. Rheum. Dis.82, 974–984 (2023). - PMC - PubMed
    1. Zhang, Y. et al. Recharge of chondrocyte mitochondria by sustained release of melatonin protects cartilage matrix homeostasis in osteoarthritis. J. Pineal Res73, e12815 (2022). - PubMed
    1. Lemasters, J. J. Selective mitochondrial autophagy, or mitophagy, as a targeted defense against oxidative stress, mitochondrial dysfunction, and aging. Rejuvenation Res8, 3–5 (2005). - PubMed
    1. Jiang, L. et al. Activation of BK channels prevents diabetes-induced osteopenia by regulating mitochondrial Ca2+ and SLC25A5/ANT2-PINK1-PRKN-mediated mitophagy. Autophagy20, 2388–2404 (2024). - PMC - PubMed

MeSH terms