Meta-Analysis
. 2025 Mar 14;16(1):2543.
doi: 10.1038/s41467-025-57868-6.

Meta-analysis of heat-induced changes in cardiac function from over 400 laboratory-based heat exposure studies

Affiliations
Meta-Analysis

Meta-analysis of heat-induced changes in cardiac function from over 400 laboratory-based heat exposure studies

Robert D Meade et al. Nat Commun. .

Abstract

Heat waves are associated with increased fatalities from adverse cardiovascular events attributed to the negative effects of heat on cardiac function. However, scientific understanding of acute cardiac adjustments to heat has come primarily from laboratory experiments employing insulated and encapsulated heating modalities, most commonly water-perfused suits. We evaluated whether findings from those studies reflect cardiac responses during more natural exposures to hot ambient conditions simulated in climate-controlled chambers by synthesizing the findings from over 400 laboratory-based heat exposure studies (6858 participant-exposures) published between 1961-2024. Among all included studies, median (interquartile range) elevations in core temperature and heart rate from baseline to end-exposure were 0.9 (0.5-1.3)°C and 27 (15-40) beats/min. Multilevel mixed-effects meta-analyses revealed exacerbated elevations in heart rate, cardiac output, and rate pressure product (estimate of cardiac workload) and blunted falls in systolic pressure in participants heated via encapsulated modalities. Leveraging the large dataset, we also provide empirical estimates of body temperature and cardiovascular responses to a wide range of conditions experienced during heat waves. With rising global temperatures, ecologically-minded physiological research is needed to improve understanding of the effects of heat stress on cardiac responses and further the development of robust climate health models and evidence-based heat-health guidance.


Conflict of interest statement

Competing interests: The authors declare no competing interests.

Figures
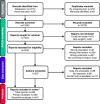
Fig. 1
Fig. 1. Flow of studies through the review.
A Preferred Reporting Items for Systematic Reviews and Meta-Analyses (PRISMA) flowchart showing the flow of studies through the review. *Of 438 eligible reports, 28 reported secondary analyses of data already included in the review. These studies were not included in analyses. Data from 10 studies that only heated participants via radiant (e.g., infrared or radiofrequency) or conductive (e.g., heated blankets) heating modalities, in the standing posture, or in high clothing insulation (e.g., nuclear, biological, chemical suit) were also omitted from the primary analysis but included in sensitivity analyses.
Fig. 2
Fig. 2. Geographical distribution and publication dates of included studies.
The size of the bubbles in the top panel indicates the number of studies from each location. The color shows the geographical density, which considers both the number of studies from each location and their proximity to other study locations. The world map was generated using the opensource R package rnaturalearth.
Fig. 3
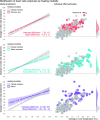
Fig. 3. Association between core temperature and heart rate in each heating modality.
Figure shows the model-predicted relation between the change in heart rate and core temperature in studies heating participants via a climate chamber (grey, reference), water-perfused suit (red, top), water immersion (aqua, middle), and sauna (purple, bottom). Models are also adjusted for the core temperature measurement technique. Model predictions (left) are presented as means (lines) and 95% confidence intervals (shaded ribbons). The latter were produced via a sandwich estimator with small-sample correction. Analyses were also adjusted for the method used to measure core temperature. Model diagnostics are provided in supplemental Figures S27–S30 (pp 71–74). Included covariates explained a statistically significant portion of variance across included studies (omnibus test of covariates: two-sided P < 0.001). However, considerable residual heterogeneity was still observed (QE test: two-sided P < 0.001), with 93.5 [92.5, 94.4]% of total variance not explained by sampling variance (overall I2; 57.1 [50.1, 63.1]% between-study I2 and 36.4 [31.3, 41.9]% within-study I2). Model estimates and P-values (reported in the main text) were not adjusted for multiple comparisons. Individual effect estimates (right) are sized according to their weight in the meta-analytic model. The marginal distribution of individual effect estimates (unweighted) for each heating modality is depicted on the right side of the panel. The effect estimate for the seminal study by Rowell et al. is also highlighted, which was among the first to assess the physiological limits of cardiac responses to heat exposure and is also commonly cited in translational reviews describing heat’s effects on the heart.
Fig. 4
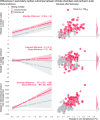
Fig. 4. Association between core temperature and secondary cardiac outcomes in the climate chamber and perfusion suit studies.
Figure shows the model-predicted relations of the change in cardiac output (top; 79 studies, 114 effect estimates), systolic blood pressure (middle; 212 studies, 337 effect estimates), and rate pressure product (bottom; 205 studies, 303 effect estimates) as a function of the change in core temperature from baseline to end-heating in studies employing a climate chamber (gray) or perfusion suit (red) to induce heat stress. Model predictions (left) are presented as means (lines) and robust 95% confidence intervals. Analyses were also adjusted for the method used to measure core temperature. Model estimates and P-values (reported in the main text) were not adjusted for multiple comparisons. Data for hot water immersion and sauna studies are shown in supplemental Figures S33-S35 (pp 89–90), respectively. Model diagnostics are provided in supplemental Figures S35-S46 (pp 92−103). Model estimates and P-values (reported in the main text) were not adjusted for multiple comparisons. Individual effect estimates (right) are sized according to their weight in the meta-analytic model. The marginal distribution of individual effect estimates (unweighted) for each outcome modality is depicted on the right side of the panel. The effect estimate for the seminal study by Rowell et al. is also highlighted, which was among the first to assess the physiological limits of cardiac responses to heat exposure and is also commonly cited in translational reviews describing heat’s effects on the heart.
Fig. 5
Fig. 5. Changes in core temperature and heart rate with increasing ambient heat stress in the climate chamber studies.
Figure shows the model-predicted relation between the change in core temperature (top, red) and heart rate (bottom, purple) with increasing heat index in studies exposing participants to ambient heat stress in a climate chamber (k = 68 studies, n = 103 effect estimates). Model predictions are presented as means (lines) and robust 95% confidence intervals (shaded ribbons). Heat index was modeled via a restricted cubic (natural) spline. Predictions for a model in which heat index was included as a linear term are also shown (dark grey dashed lines). Models were adjusted for sample mean age and the duration of heat stress. Model outputs are shown for a hypothetical study with a sample mean age of 27 years and 100 min of heat exposure (based on the sample size-weighted medians of the analyzed studies). Model diagnostics are provided in supplemental Figures S51–S66 (pp 112–127). Model estimates and P-values (reported in the main text) were not adjusted for multiple comparisons. Individual effect estimates (grey bubbles) are sized according to their weight in the meta-analytic model. The marginal distribution of the individual effect estimates (unweighted) is depicted on the right side of the panel.
Fig. 6
Fig. 6. Estimated core temperatures, heart rates, and systolic pressures during recent heat waves.
Figure shows model predictions (points) and robust 95% confidence intervals (error bars) for hypothetical groups (studies) of young (mean age: 25 years; sample weighted median below 65 years) and older adults (mean age: 70 years; sample weighted median above 65 years) resting for 2 h in peak conditions measured in recent heat waves in British Columbia, Canada (2021, gray), Bangkok, Thailand (2023, aqua), Asaluyeh, Iran (2022, purple), and Sikkim, India (2022, blue),. Predictions are presented as means (points) and robust 95% confidence intervals (error bars) produced by adding the estimated change in each variable from the models presented in Fig. 5 (core temperature and heart rate, k = 68 studies, n = 103 effect estimates) and supplemental Table S34 (systolic pressure; k = 34 studies, n = 55 effect estimates) to the sample-weighted model median baseline values (grey horizontal lines).

References

    1. Alahmad, B. et al. Cardiovascular mortality and exposure to heat in an inherently hot region: implications for climate change. Circulation141, 1271–1273 (2020). - PMC - PubMed
    1. Bunker, A. et al. Effects of air temperature on climate-sensitive mortality and morbidity outcomes in the elderly; a systematic review and meta-analysis of epidemiological evidence. EBioMedicine6, 258–268 (2016). - PMC - PubMed
    1. Scovronick, N. et al. Temperature-mortality associations by age and cause: a multi-country multi-city study. Environ. Epidemiol.8, e336 (2024). - PMC - PubMed
    1. Khraishah, H. et al. Climate change and cardiovascular disease: implications for global health. Nat. Rev. Cardiol.19, 798–812 (2022). - PubMed
    1. Chaseling, G. K., Morris, N. B. & Ravanelli, N. Extreme heat and adverse cardiovascular outcomes in Australia and New Zealand: What do we know? Heart Lung Circ.32, 43–51 (2022). - PubMed

Publication types

LinkOut - more resources