. 2025 Mar 14;16(1):2431.
doi: 10.1038/s41467-025-57760-3.

Potentially causal associations between placental DNA methylation and schizophrenia and other neuropsychiatric disorders

Affiliations

Potentially causal associations between placental DNA methylation and schizophrenia and other neuropsychiatric disorders

Ariadna Cilleros-Portet et al. Nat Commun. .

Abstract

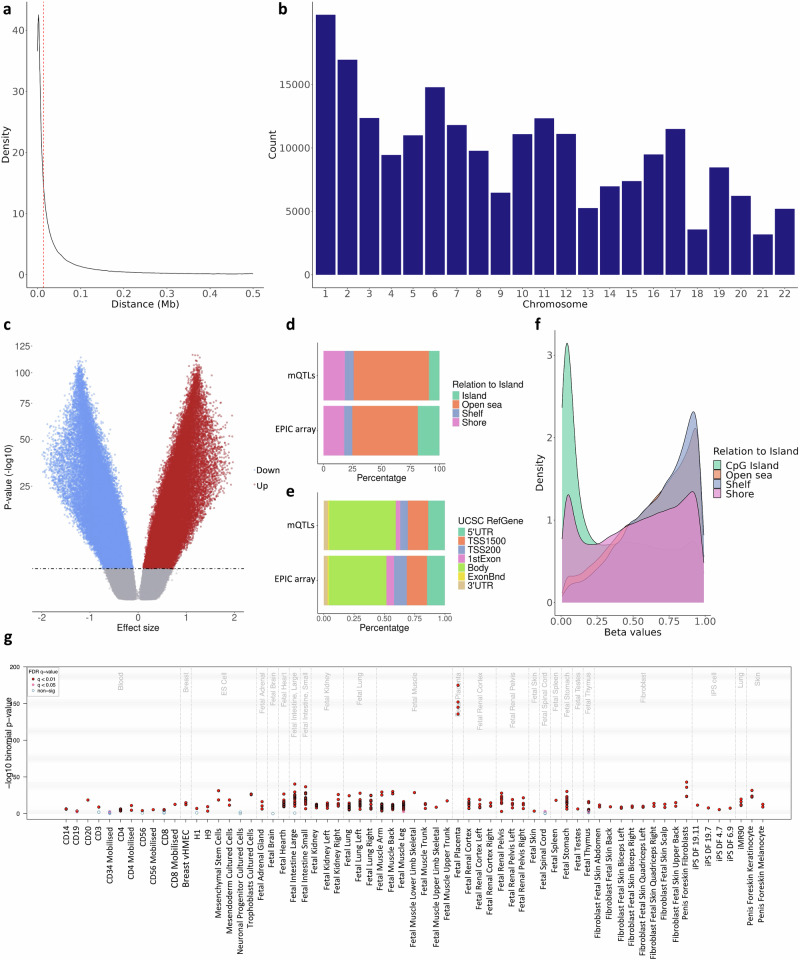
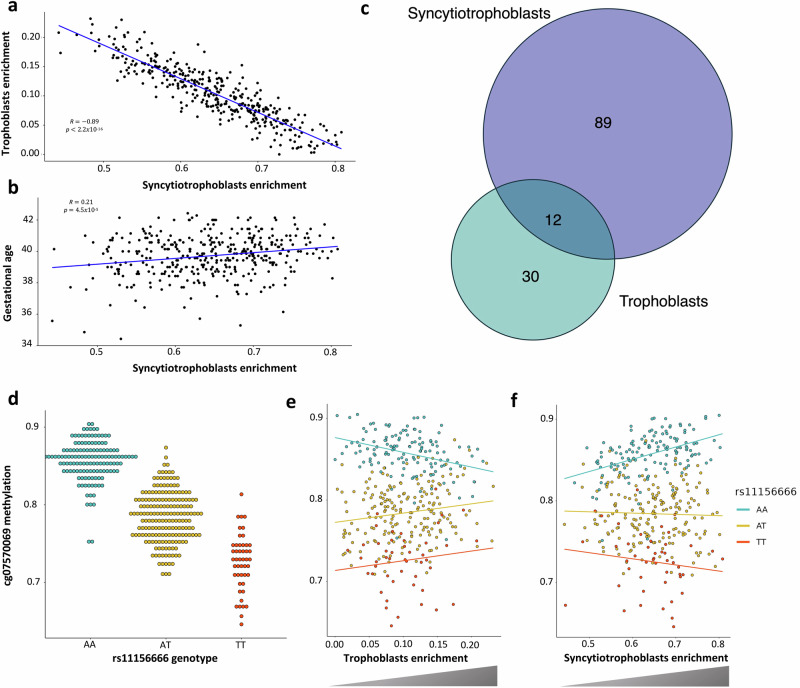
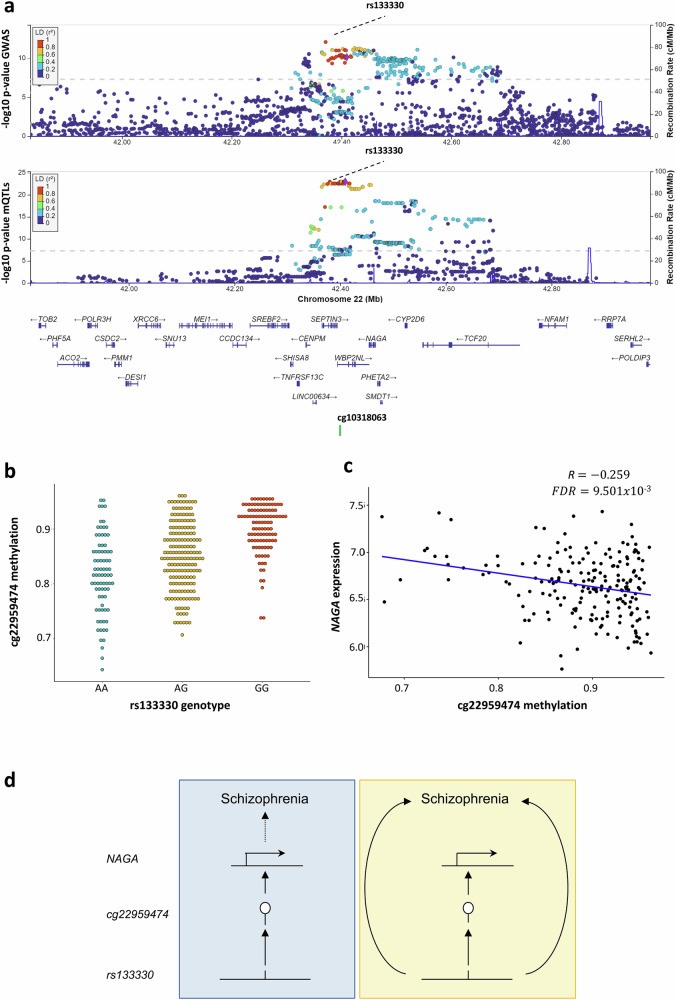
Increasing evidence supports the role of the placenta in neurodevelopment and in the onset of neuropsychiatric disorders. Recently, mQTL and iQTL maps have proven useful in understanding relationships between SNPs and GWAS that are not captured by eQTL. In this context, we propose that part of the genetic predisposition to complex neuropsychiatric disorders acts through placental DNA methylation. We construct a public placental cis-mQTL database including 214,830 CpG sites calculated in 368 fetal placenta DNA samples from the INMA project, and run cell type-, gestational age- and sex-imQTL models. We combine these data with summary statistics of GWAS on ten neuropsychiatric disorders using summary-based Mendelian randomization and colocalization. We also evaluate the influence of identified DNA methylation sites on placental gene expression in the RICHS cohort. We find that placental cis-mQTLs are enriched in placenta-specific active chromatin regions, and establish that part of the genetic burden for schizophrenia, bipolar disorder, and major depressive disorder confers risk through placental DNA methylation. The potential causality of several of the observed associations is reinforced by secondary association signals identified in conditional analyses, the involvement of cell type-imQTLs, and the correlation of identified DNA methylation sites with the expression levels of relevant genes in the placenta.


Conflict of interest statement

Competing interests: The authors declare no competing interests.

Figures

Fig. 1
Fig. 1. Characterization of the placental cis-mQTLs from the permuted database.
The distance between the SNP-CpG pairs participating in the reported cis-mQTLs is displayed as (a) density plot, where the X-axis represents the absolute distance in Mb. The red line represents the absolute median SNP-CpG distance. The distribution of the reported cis-mQTLs along the chromosomes is shown in the (b) barplot, where the X-axis represents the autosomal chromosomes. The distribution of the effect sizes from the reported cis-mQTLs is pictured in the (c) volcano plot, where the Y-axis illustrates the −log10 beta P-value, and the X-axis the effect size. The blue and the red dots represent the significant mQTLs below a threshold of 5 × 10−8 in the nominal database with a negative and positive effect, respectively. The distribution of the EPIC array probes and the nominal mSites considering the Relation To Island and the UCSC RefGene annotation is displayed in the (d, e) bar plots, respectively. The DNAm beta values of the participating mSites stratified by the Relation To Island annotation are shown in the (f) density plot, where the DNAm values are found on the X-axis. The eFORGE enrichment of DNase I hotspots considering the top 10,000 permuted mSites is shown in the (g) plot. The Y-axis represents the −log10 P-value of the binomial enrichment test as suggested by the eFORGE developers, and the X-axis the tissues studied. FDR-corrected q-values below 0.01 and 0.05 are represented by red and pink dots, respectively, while blue dots show q-values > 0.05.
Fig. 2
Fig. 2. STB- and TB-imQTLs.
The Pearson correlation between STB and TB cell types (N = 368) is shown in (a), the X-axis representing the STB proportion in the sample set, and the Y-axis showing the estimated TB proportion. The Pearson correlation between STB and GA (N = 368) is shown in (b), the X-axis representing the STB proportion in the sample set, and the Y-axis showing the GA. The intersection between STB- and TB-imQTLs is represented in the (c) Venn diagram. The standard cg07570069-rs7150262 mQTL, as well as the TB- and STB-imQTLs, are displayed in the (df) dot plots, respectively. In all three, the Y-axes represent the cg07570069 DNAm beta values, ranging from 0 to 1. In d the X-axis displays the genotype of rs7150262, while in (e, f), the X-axes show the TB and STB proportions, respectively. The P-values of the (i)mQTLs were the following: Pnominal = 1365 × 1097, eigenMT FDR = 2.362 × 102, and eigenMT FDR = 1.579 × 104 for the standard mQTL, and the TB- and STB-imQTLs, respectively, obtained by linear regression calculations in TensorQTL.
Fig. 3
Fig. 3. Manhattan plot of BIP, MDD, and SCZ GWAS highlighting the SMR and coloc results.
The original GWAS from BIP, MDD, and SCZ were plotted in the (ac) Manhattan plots, respectively. In the Y-axes the original −log10 P-values are displayed with the genome-wide suggestive association threshold of 1 × 105 depicted as a dashed line, while chromosomes are shown in the X-axis. The blue dots represent genomic regions significantly colocalizing (PP4 > 0.8) with our placental mQTLs, and the red dots are mVariants associated with CpGs that have been shown to pleiotropically associate with either BIP, MDD, or SCZ in the SMR approach (Bonferroni PSMR < 0.05 and PHEIDI > 0.05). Therefore, the blue dots represent the colocalization results, and the red dots show the SMR results.
Fig. 4
Fig. 4. A CpG pleiotropically associated with MDD.
The mVariant rs1950835, highlighted as a purple diamond, with the −og10 P-values of the original MDD GWAS and the placental mQTLs, is represented in the (a) locusZoom plot. The X-axis displays the involved genomic region of chromosome 14 in Mb, showing the distribution of the coding genes in the locus, as well as the location of the cg10318063 mSite (PP4 = 0.976 in the colocalization test). The Y-axis shows the −log10 P-value from the original GWAS and placental mQTLs, and the SNPs are color-coded as a function of the LD with the highlighted SNP considering the 1000G reference panel. The mQTL, rs1950835-cg10318063 (Pnominal = 2.446 × 1034 of the linear regression in TensorQTL) is plotted in the (b) dotplot, where the Y-axis represents the beta DNAm values of the mSite, ranging from 0 to 1. The X-axis displays the genotype of the mVariant. The eQTM of cg10318063 is portrayed in the (c) dotplot, where the X-axis represents the DNAm values of the CpG involved, ranging from 0 to 1. The Y-axis displays the expression values of the LRFN5 gene in the placenta. The hypothesis of the pleiotropical association between the SNP, the DNAm values of the CpG in the placenta, and the gene expression levels of LRFN5 in the placenta and MDD are schematically represented in (d). The vertical pleiotropy (or causal association) hypothesis is represented with a blue background, and the horizontal pleiotropy hypothesis is highlighted with a yellow background.
Fig. 5
Fig. 5. A CpG pleiotropically associated with SCZ.
The mVariant rs133330, highlighted as a purple diamond, with the −log10 P-values of the original SCZ GWAS and the placental mQTLs, is represented in the (a) locusZoom plot. The X-axis displays the involved genomic region of chromosome 22 in Mb, showing the distribution of the coding genes in the locus, as well as the location of the cg22950474 mSite (PP4 = 0.901 in the colocalization test). The Y-axis shows the −log10 P-value from the original GWAS and placental mQTLs, and the SNPs are color-coded as a function of the LD with the highlighted SNP considering the 1000 G reference panel. The mQTL, rs133330-cg22950474 (Pnominal = 1.871 × 1010 of the linear regression in TensorQTL) is plotted in the (b) dotplot, where the Y-axis represents the beta DNAm values of the mSite, ranging from 0 to 1. The X-axis displays the genotype of the mVariant. The eQTM of cg22950474 is portrayed in the (c) dotplot, where the X-axis represents the DNAm values of the CpG involved, ranging from 0 to 1. The Y-axis displays the expression values of the NAGA gene in the placenta. The hypothesis of the pleiotropical association between the SNP, the DNAm values of the CpG in the placenta, the gene expression levels of NAGA in the placenta, and SCZ are schematically represented in (d). The vertical pleiotropy (or causal association) hypothesis is represented with a blue background, and the horizontal pleiotropy hypothesis is highlighted with a yellow background.
Fig. 6
Fig. 6. TB-imQTL pleiotropically associated with BIP.
The imVariant rs11637580, highlighted as a purple diamond, is shown in the original BIP GWAS in the (a) locusZoom plot. The X-axis displays the involved genomic region in chromosome 15 in Mb, showing the distribution of the coding genes in the locus, as well as the location of the imSite cg27130493. The Y-axis shows the −log10 P-value from the original GWAS, and the SNPs are color-coded as a function of LD with the highlighted SNP considering the 1000 G reference panel. The TB-imQTL (Pnominal = 1.671 × 108 of the linear regression in TensorQTL) is pictured in the (b) dotplot. The X-axis represents the cg27130493 DNAm beta values and the Y-axis the TB proportion, both ranging from 0 to 1. The genotype of the rs11637580 imVariant is color-coded as indicated in the legend.
Fig. 7
Fig. 7. Overlap between the SMR results in brain, placenta, and fetal brain, in BIP, MDD, and SCZ.
The overlap between the mSites pleiotropically associated between the three tissues and BIP, MDD, and SCZ are represented in the (ac) Venn diagrams, respectively. Overlapping mSites are shown, and also the closest gene from the Illumina annotation file (between brackets).

Update of

References

    1. Strauss, R. S. Effects of the intrauterine environment on childhood growth. Br. Med. Bull.53, 81–95 (1997). - PubMed
    1. Barker, D. J. The fetal and infant origins of adult disease. BMJ301, 1111 (1990). - PMC - PubMed
    1. O’Donnell, K., O’Connor, T. G. & Glover, V. Prenatal stress and neurodevelopment of the child: focus on the HPA axis and role of the placenta. Dev. Neurosci.31, 285–292 (2009). - PubMed
    1. Lapehn, S. & Paquette, A. G. The placental epigenome as a molecular link between prenatal exposures and fetal health outcomes through the DOHaD hypothesis. Curr. Environ. Health. Rep.9, 490–501 (2022). - PMC - PubMed
    1. Bhattacharya, A. et al. Placental genomics mediates genetic associations with complex health traits and disease. Nat. Commun.13, 706 (2022). - PMC - PubMed

LinkOut - more resources