. 2025 Mar 14;8(1):438.
doi: 10.1038/s42003-025-07853-y.

An automated high-throughput lighting system for screening photosynthetic microorganisms in plate-based formats

Affiliations

An automated high-throughput lighting system for screening photosynthetic microorganisms in plate-based formats

Avery J C Noonan et al. Commun Biol. .

Abstract

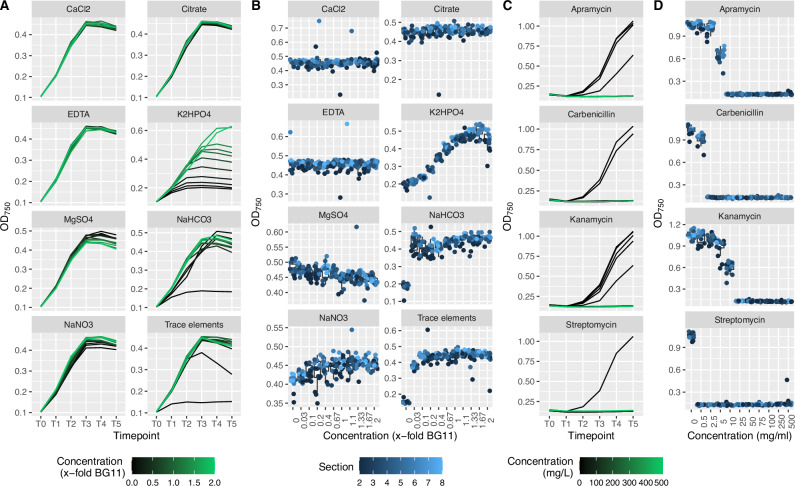
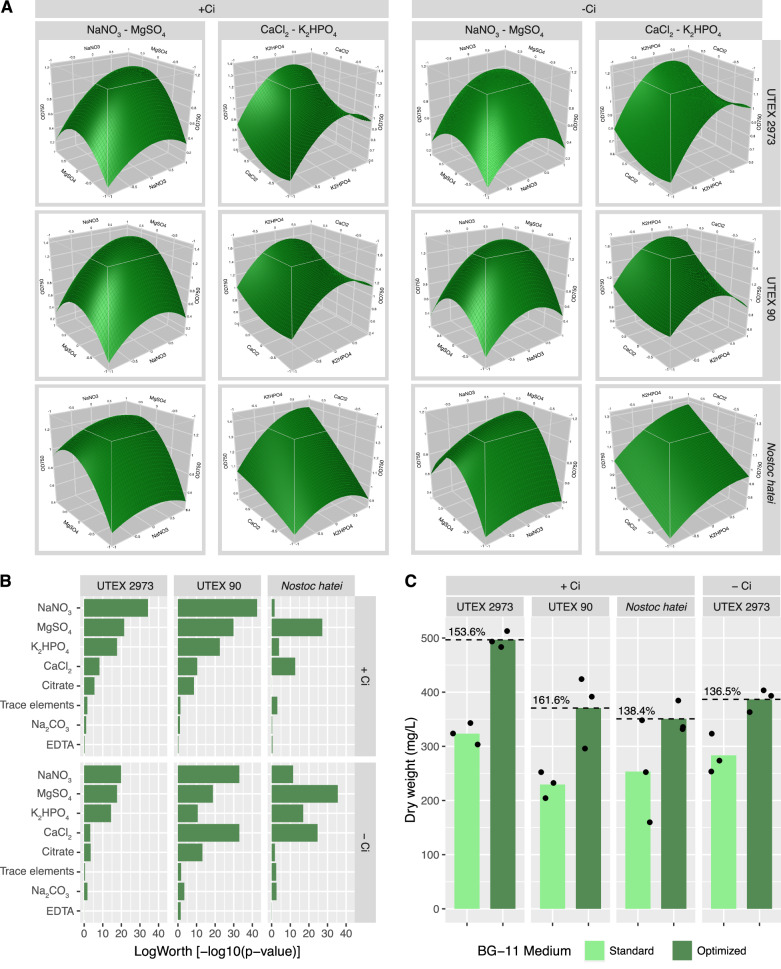
The capacity of photosynthetic microorganisms to fix carbon dioxide into biomass positions them as promising cell factories for sustainable biomanufacturing. However, limitations in screening throughput hinder the identification of enzymes, strains, and growth conditions needed to realize this potential. Here we present a microplate-based high-throughput cultivation system that can be integrated into existing automation infrastructure and supports growth of both prokaryotic and eukaryotic photosynthetic microorganisms. We validate this system by optimizing BG-11 medium compositions for Synechococcus elongatus UTEX 2973, Chlamydomonas reinhardtii UTEX 90 and Nostoc hatei CUBC1040, resulting in growth rates increases of 38.4% to 61.6%. We also identify small molecules that influence growth rates in Synechococcus elongatus UTEX 2973, including candidate compounds for growth rate increase and dozens that prevent growth. The sensitivity, throughput, and extensibility of this system support screening, strain isolation, and growth optimization needed for the development of photosynthetic microbial cell factories.


Conflict of interest statement

Competing interests: S.J.H. is a co-founder of Koonkie Inc., a bioinformatics consulting company that designs and provides scalable algorithmic and data analytics solutions in the cloud. All other authors declare no competing interests.

Figures

Fig. 1
Fig. 1. Overview of lighting system form factor and integration into the Cytomat 5 C450 incubator.
A Each of 5 racks can hold up to 10 LED arrays and microplates, enabling the screening of up to 3840 distinct cultures per rack, for a total incubator capacity of 19,200 cultures. LED array and support frame are placed directly beneath microplates and provide illumination upwards. Terminal blocks are mounted to each rack to connect to slipring and split power between LED arrays. An additional intermediate set of terminal blocks is required to split power between multiple racks. The slipring and slipring connector enable rotation of the carousel within the Cytomat 5 C450 incubator. A single set of positive and negative wires connects slipring to the LED driver and dimming circuit. B LED array and support structure conform to the form factor of standard 384-well microplates, as defined by the Society for Laboratory Automation and Screening (SLAS). 384 individual LEDs sit directly beneath wells. Grooves in the support structure secure the LED array and ridges on the outside of the structure ensure proper placement within the Cytomat 5 C450 rack. This figure was generated by Arman Aituar.
Fig. 2
Fig. 2. Plate type comparison.
Growth and photopigment production in Synechococcus elongatus UTEX 2973 were compared between and across 3 black-well and 3 clear-well 384-well microplates. A Growth in black-well plates is slightly delayed in comparison to clear-well plates but reaches comparable OD750 values after approximately 72 h. Growth rates in clear plates were relatively constant over the 8-day cultivation experiment, whereas growth rates peaked in black plates after 3 days of cultivation. Each point represents a median of 384 values across a single microplate. B To compare growth rates across a plate, plates were divided into 8 sections, based on location on the plate. These sections will be used for downstream evaluation of growth rate and photopigment production across the microplate. C Variability in OD750 values by plate section at T3 and T5. D Density plots at T5 show the lower distribution of OD750 values in section 1 in black-well plates and the positive skew of OD750 values in clear-well plates. E Relative Chlorophyll a (444 nm) and carotenoid (495 nm) absorbance are significantly lower in black-well plates. Phycocyanin (634 nm) absorbance follows a similar trend in black- and clear-well plates. Each point represents a median of 384 values across a single microplate. F Relative photopigment fluorescence at T5 stays consistent across individual black- and clear-well microplates but with significantly more variability in the clear-well plate. This increase in the number of low outliers mirrors the high outliers observed in OD750 values in clear-well plates.
Fig. 3
Fig. 3. BG-11 medium component concentration and antibiotic sensitivity testing in Synechococcus elongatus UTEX 2973.
To demonstrate applicability of the lighting system, the impact of individually varying the concentration of each of the 8 components of BG-11 medium was tested. 8 components at 11 concentrations and with 7 replicates per concentration were distributed randomly across sections 2–8 of two black-well microplates, resulting in 716 individual cultures. A Growth curves show impact of nutrient limitation over the course of a 120 h experiment. B Response curves at T3 (72 h) show limiting nutrients and tight condition-dependent clustering of OD750 values. Sensitivity to 4 antibiotics was tested at 11 concentrations and with 7 replicates per concentration. C Growth curves show impact of on growth rate over the course of a 120 h experiment. D Response curves at T3 (72 h) show antibiotic sensitivity and tight condition-dependant clustering of OD750 values.
Fig. 4
Fig. 4. BG-11 medium optimization and response surface modelling.
BG-11 optimization and RSM were performed through a 61-condition, 8-factor central composite design experiment. A Response surface model showing the relationships between components NaNO3 and MgSO4 and components CaCl2 and K2HPO4, as well as their predicted impact of growth. B Predicted effects of individual medium components on growth of each strain with or without NaHCO3. Values are plotted as LogWorth = −log10(p-value). C Flask-based cultivation in standard and optimized BG-11 media showed reproducible increases in biomass accumulation over 7-day cultivation experiments. Points represent biomass from individual 50 mL flask cultures. Green bars represent mean biomass of three flasks in standard and optimized medium.
Fig. 5
Fig. 5. High-throughput bioactive molecule screening and gradient testing of select candidate compounds.
A Round 1 of bioactive molecule screen was run in two sets, monitoring OD750 values in each well. Shades of grey indicate OD750 from 14 384-well plates. Solid lines represent median OD750 values for each set. B Plate-by-plate Z-scores were calculated to normalize data and identify outliers. Colour represents selected outliers (dark green). Solid line represents Z-score of 0. Dashed lines represent Z-score of ± 2.5. Data showed near normal distribution. C All OD750 data points from round 2 screening. 146 hits (each in triplicate) and 396 negative control wells, across three 384-well plates. D Selected hits from round 2 with negative control wells. Negative control data showed a positively skewed distribution. E Round 3 gradient testing for selected hits inducing growth and F inhibiting growth. Line colours indicate selected compounds for downstream testing. G Lines show a median of 8–12 replicate wells at each concentration of selected candidate compounds. H Fold-change in OD750 compared to negative control wells (no gossypetin treatment), showing 12 replicates at each concentration [non-linear x-axis]. I Median (solid), 25th percentile (dashed), and 75th percentile (dashed) OD750 measurements across 15 gossypetin concentrations [linear x-axis]. J Flask-based cultivation at 10 μM and 20 μM gossypetin showed reproducible increases in biomass accumulation over a 7-day cultivation experiment.

References

    1. Azam, F. & Malfatti, F. Microbial structuring of marine ecosystems. Nat. Rev. Microbiol.5, 782–791 (2007). - PubMed
    1. Novotny, A. et al. DNA metabarcoding highlights cyanobacteria as the main source of primary production in a pelagic food web model. Sci. Adv.9, eadg1096 (2023). - PMC - PubMed
    1. Berla, B. M. et al. Synthetic biology of cyanobacteria: unique challenges and opportunities. Front. Microbiol.4, 246 (2013). - PMC - PubMed
    1. Angermayr, S. A., Gorchs Rovira, A. & Hellingwerf, K. J. Metabolic engineering of cyanobacteria for the synthesis of commodity products. Trends Biotechnol.33, 352–361 (2015). - PubMed
    1. Khan, M. I., Shin, J. H. & Kim, J. D. The promising future of microalgae: current status, challenges, and optimization of a sustainable and renewable industry for biofuels, feed, and other products. Microb. Cell Factories17, 36 (2018). - PMC - PubMed

MeSH terms

Supplementary concepts

LinkOut - more resources