. 2025 Apr;7(4):808-822.
doi: 10.1038/s42255-025-01246-5. Epub 2025 Mar 14.

Human gut microbial aromatic amino acid and related metabolites prevent obesity through intestinal immune control

Affiliations

Human gut microbial aromatic amino acid and related metabolites prevent obesity through intestinal immune control

Zengliang Jiang et al. Nat Metab. 2025 Apr.

Abstract

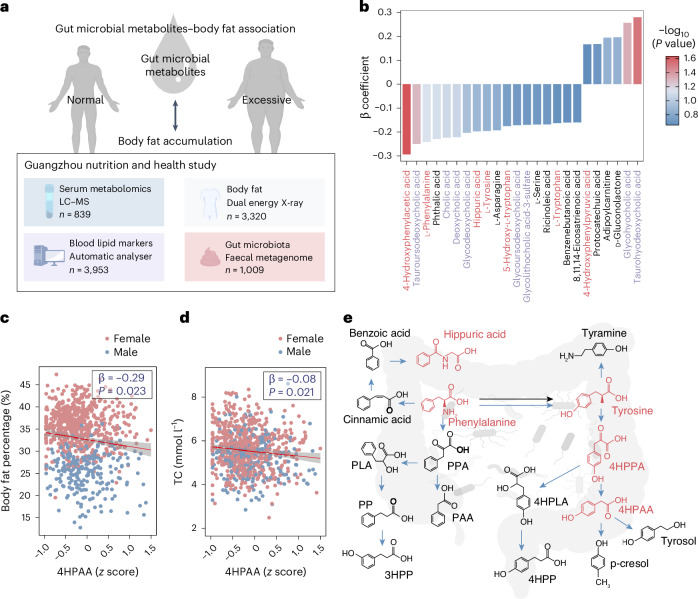
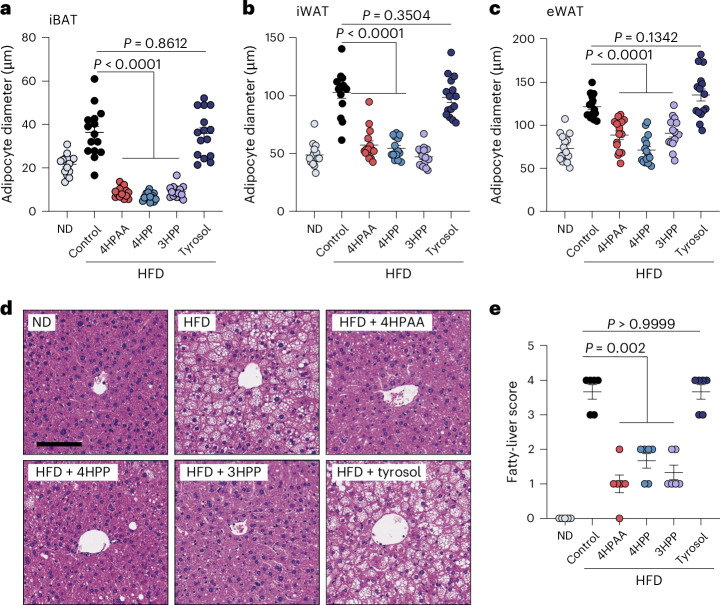
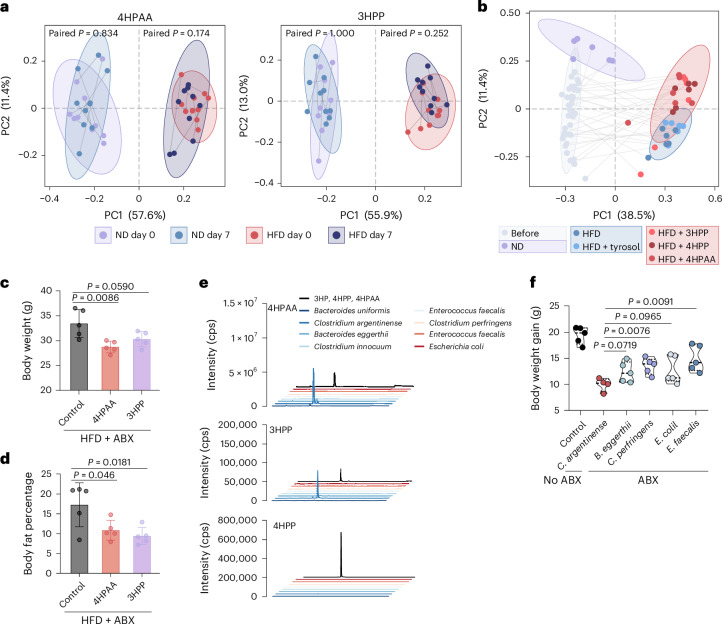
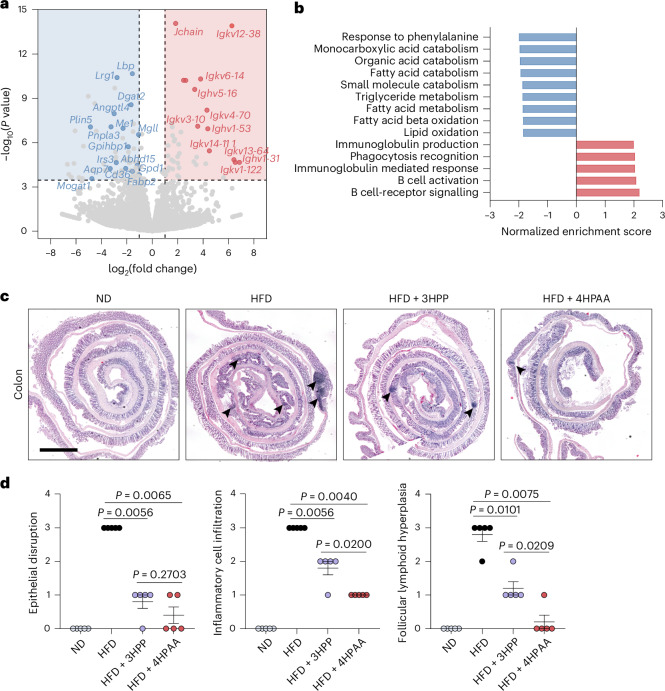
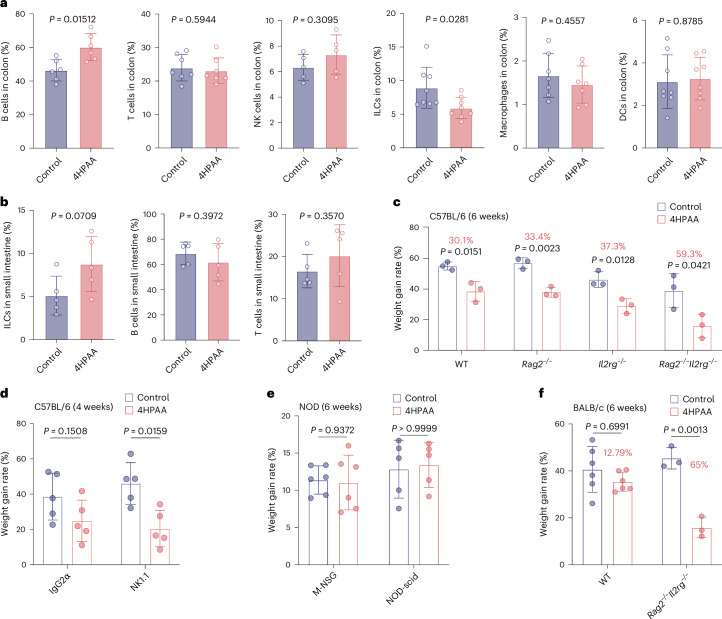
Obesity affects millions of people in the world. The gut microbiome influences body fat accumulation, but the mechanisms remain to be investigated. Here, we show an association between microbial aromatic amino acid metabolites in serum and body fat accumulation in a large Chinese longitudinal cohort. We next identify that 4-hydroxyphenylacetic acid (4HPAA) and its analogues effectively protect male mice from high-fat-diet-induced obesity. These metabolites act on intestinal mucosa to regulate the immune response and control lipid uptake, which protects against obesity. We further demonstrate that T cells and B cells are not vital for 4HPAA-mediated obesity prevention, and innate lymphoid cells have antagonistic roles. Together, these findings reveal specific microbial metabolites as pivotal molecules to prohibit obesity through immune control, establishing mechanisms of host modulation by gut microbial metabolites.


Conflict of interest statement

Competing interests: A patent using related molecules to prevent and treat obesity has been filed by Westlake University, with J.Z., L.AT., L.H., Diyin Li and Z.J. listed as inventors. The remaining authors declare no competing interests.

Figures

Fig. 1
Fig. 1. Microbial AAA metabolism is associated with human body fat accumulation.
a, Diagram of the human cohort (created in BioRender: https://BioRender.com/x34z513). LC–MS, liquid chromatography-tandem mass spectrometry. b, The association of different microbial metabolites in human serum samples (n = 839) with body fat accumulation was assessed and ranked on the basis of beta coefficients. Top-ranked metabolites are shown. AAA-related metabolites are marked in red, and cholic-acid-related metabolites are shown in purple. c,d, Scatter plots showing the association of serum 4HPAA levels with whole-body fat accumulation (c) and the concentration of blood total cholesterol (TC) (d). Multivariable linear regression was used, adjusted for age, sex, body mass index (BMI), smoking status, alcohol status, physical activity, education, income and total energy intake. Regression (β) coefficients with 95% confidence intervals and P values were calculated. All statistical tests were two-sided. e, Schematic of the related microbial Phe and Tyr metabolic pathways in this study. Host and microbial pathways are indicated in black and blue arrows, respectively. Metabolites associated with body fat accumulation in the cohort are highlighted in red. PLA, phenyllactic acid; PPA, phenylpyruvic acid; PP, phenylpropionic acid; PAA, phenylacetic acid; 4HPPA, 4-hydroxyphenylpyruvic acid; 4HPLA, 4-hydroxyphenyllactic acid. Source data
Fig. 2
Fig. 2. Oral intake of 4HPAA, 3HPP or 4HPP suppresses weight gain in HFD-fed mice.
a, Schematic of oral treatment in the HFD mouse model and a representative image of normal diet (ND)-fed, HFD-fed and HFD-fed plus 4HPAA-treated (8 weeks) mice. b, Box and whisker plots showing weight gain in ND-fed and HFD-fed mice with or without 4HPAA treatment for 8 weeks (n = 11 mice per group). c, Box and whisker plots showing the body fat percentage of ND-fed and HFD-fed mice with or without 4HPAA treatment for 8 weeks (n = 5 mice per group). d, Structural formulas of 4HPAA, 3HPP, 4HPP and tyrosol. e, Body weight growth curve of ND- and HFD-fed mice with or without treatment with 4HPAA, 4HPP, 3HPP or tyrosol in the drinking water. Data are shown as mean ± s.e.m. f, Box and whisker plots showing the body weight gain of ND- or HFD-fed mice with or without oral treatment of 4HPAA, 4HPP, 3HPP or tyrosol for 10 weeks. g, Box and whisker plots showing the body fat percentage of ND- and HFD-fed mice with or without oral treatment with 4HPAA, 4HPP, 3HPP or tyrosol for 10 weeks. In eg, n = 5 mice in the ND groups and 15 mice in other groups. In all box and whisker plots, box limits indicate the interquartile range, centre line denotes the median, and the upper and lower whiskers indicate maximum and minimum values. Statistical analysis was performed using the two-tailed Mann–Whitney U test. All experiments were repeated at least twice independently, with similar results. Source data
Fig. 3
Fig. 3. The metabolites alleviate adipocyte hypertrophy and hepatic steatosis.
ac, The average diameters of adipocytes in iBAT (a), iWAT (b) and eWAT (c) were measured and plotted on the charts (n = 15 mice per group). d, Representative images of H&E-stained liver sections from ND- or HFD-fed mice orally treated with or without 4HPAA, 4HPP, 3HPP or tyrosol after 10 weeks. Scale bar, 100 μm. e, Fatty liver histological scores were assessed and plotted on the diagram. Data are shown as mean ± s.e.m., n = 5 mice in the ND groups and 6 mice in the other groups. Statistical analysis was performed using the two-tailed Mann–Whitney U test. All experiments were biologically repeated twice, with similar results. Source data
Fig. 4
Fig. 4. Metabolic characteristics of 4HPAA- and 3HPP-fed mice.
a, The weekly food intake of HFD-fed mice with or without treatment with 4HPAA, 3HPP or 4HPP for 12 weeks. bd, The energy expenditure of HFD-fed mice treated with or without 4HPAA (b), 3HPP (c) or 4HPP (d) for 12 weeks (n = 5 mice per group). e, The faecal triglyceride content of HFD-fed mice treated with or without 4HPAA, 3HPP or 4HPP for 12 weeks (n = 6 mice per group). f, Oral glucose tolerance test (OGTT) of HFD-fed mice with or without treatment with 4HPAA, 3HPP or 4HPP for 12 weeks (n = 12 mice for the control group and 6 mice for other groups). g, Insulin tolerance tesr (ITT) of the HFD-fed mice with or without treatment with 4HPAA, 3HPP or 4HPP for 12 weeks (n = 12 mice for the control group and 6 mice for other groups). Data are shown as mean ± s.d. Statistical analysis was performed using the two-tailed Mann–Whitney U test. Experiments were repeated twice independently, with similar results. Source data
Fig. 5
Fig. 5. 4HPAA and 3HPP target the intestine to maximize anti-obesity effects.
a, Schematic illustration of intraperitoneal (i.p.) injection of 4HPAA or 3HPP in an HFD mouse model. b,c, ND- or HFD-fed mice were injected intraperitoneally with saline, 4HPAA or 3HPP twice per week for 12 weeks. The box and whisker plots show the body weight gain (b) and fat percentage (c) of these mice. Box plots as in Fig. 2. d, Representative images of H&E-stained liver sections from ND- or HFD-fed mice injected intraperitoneally with saline, 4HPAA or 3HPP after 12 weeks. Scale bar, 100 μm. e, Histological fatty liver scores of mice in d. Data are shown as mean ± s.e.m. In be, n = 5 mice per group. Statistical analysis was performed using the two-tailed Mann–Whitney U test. Experiments were independently repeated twice, with similar results. Source data
Fig. 6
Fig. 6. 4HPAA and 3HPP prevent obesity independently of the microbiome.
a, The β diversity of the microbiome in HFD- and ND-fed mice treated with 4HPAA or 3HPP for 7 days (short term). n = 10 mice per group. b, The β diversity of the microbiome in different long-term treatment groups, calculated by principal component analysis (based on weighted UniFrac distances). n = 6 mice per group. c,d, HFD mice that did or did not receive oral 4HPAA or 3HPP treatment were simultaneously treated with an antibiotic cocktail (ABX) for 4 weeks (n = 5 mice per group) and body weight (c) and fat percentage (d) were determined. e, 4HPAA, 3HPP and 4HPP contents in bacterial culture supernatant measured using UPLC–MS; cps, counts per second. f, The ABX-treated pseudosterile mice were administered the indicated bacteria through oral gavage every 3 days for 8 weeks. Violin plots show the body weight gain (n = 4 for C. argentinense group and n = 5 for other groups). Data are shown as mean ± s.e.m. Statistical analysis was performed using the two-tailed Mann–Whitney U test. Experiments were independently repeated twice, with similar results. Source data
Fig. 7
Fig. 7. 4HPAA treatment reduces chronic inflammation in colonic epithelium.
a, Volcano plot of colon transcripts. Dashed lines denote the cut-off values: fold-change > 2 and log10(P) < −3.5. The top upregulated genes for B cell response and downregulated genes for lipid absorption and metabolism are highlighted in red and blue, respectively. b, Gene set enrichment analysis based on the upregulated and downregulated gene hits. c, Representative images of H&E-stained mouse colon tissue sections. Arrows denote enlarged lymphoid follicles. Scale bar, 100 μm. d, Histological scores for H&E-stained colon sections were assessed on the basis of epithelial disruption, inflammatory cell infiltration and follicular lymphoid hyperplasia (n = 5 mice per group). Data are shown as mean ± s.e.m. Statistical analysis was performed using the two-tailed Mann–Whitney U test. For c and d, experiments were independently repeated twice, with similar results. Source data
Fig. 8
Fig. 8. 4HPAA regulates body weight gain through immune control.
a, Frequencies of B cells, T cells, NK cells, ILCs, macrophages and DCs in the colon of HFD-fed mice with or without 4HPAA treatment in drinking water, measured on day 16. b, Frequencies of ILCs, B cells and T cells in the small intestine of HFD-fed mice treated with or without 4HPAA in drinking water, measured on day 16. c, Rates of body weight gain, measured on week 6, in HFD-fed C57BL/6J wild type (WT), Rag2−/−, Il2rg‒/‒ and Rag2‒/‒Il2rg‒/‒ mice that did or did not receive oral 4HPAA treatment. d, The rate of body weight gain, measured on week 4, in HFD-fed mice treated with IgG2α as a control, or an anti-NK1.1 antibody to deplete NK and ILC1 cells, that did or did not receive oral 4HPAA treatment; n = 5 mice per group. e, The rate of body weight gain, measured on week 6, in NOD-scid (n = 5 mice per group) and M-NSG (n = 6 mice per group) mice fed a HFD that did or did not receive oral 4HPAA treatment. f, The rate of body weight gain, measured on week 6, in BALB/c wild-type (n = 6 mice per group) and Rag2−/−Il2rg−/− (n = 3 mice per group) mice fed a HFD that did or did not receive oral 4HPAA treatment. The percentages of the relative reduction in weight gain between the control and 4HPAA-treated mice are highlighted in red. Data are shown as mean ± s.e.m. Statistical analysis was performed using the two-tailed Mann–Whitney U test. Experiments were independently repeated twice, with similar results. Source data
Extended Data Fig. 1
Extended Data Fig. 1. Specific microbial metabolites are inversely associated with fat percentage in the cohort.
a, The scatter plots show the association of six gut microbial metabolites with whole-bod fat accumulation (n = 839). b, The scatter plots show the association of microbial 4HPAA with fat accumulation in the trunk, android, and gynoid regions (n = 839). Multivariable linear regression was used, adjusted for age, sex, BMI, smoking status, alcohol status, physical activity, education, income, and total energy intake. Data are presented as beta coefficients with 95% confidence intervals. All statistical tests were two-sided. Source data
Extended Data Fig. 2
Extended Data Fig. 2. Specific microbial metabolites are inversely associated with TC and LDL in the cohort.
a, The distribution of fecal 4HPAA concentration in 18 human samples. b-c, The association of six gut microbial metabolites with TC (b) or LDL (c). Multivariable linear regression was used, adjusted for age, sex, BMI, smoking status, alcohol status, physical activity, education, income, and total energy intake (n = 822). Data are presented as beta coefficients with 95% confidence intervals. The statistical tests were two-sided. d, The changes of fecal 4HPAA concentration in mice after a seven-day 4HPAA intervention. n = 10 mice per group, statistical analysis was assessed by a two-tailed paired t-test. For d, the experiments were repeated twice independently with similar results. Source data
Extended Data Fig. 3
Extended Data Fig. 3. 4HPAA, 3HPP, and 4HPP have similar anti-obesity effects.
a, Body weight growth curve of HFD-fed female C57BL/6 mice treated with or without 4HPAA in drinking water. Error bars indicate mean ± SEM, n = 10 mice per group. Statistical analysis was performed using the two-tailed Mann-Whitney test. Experiments were repeated twice with similar results. b-d, The fecal 4HPAA (b), 3HPP (c), and 4HPP (d) levels after 4HPAA, 3HPP, and 4HPP treatment, respectively (n = 16 mice in the control group and n = 8 mice for other groups). Error bars indicate mean ± SD. Statistical analysis was performed using the two-tailed Mann-Whitney test. e, The Venn diagram shows that the upregulated metabolites in the 4HPAA, 4HPP, and 3HPP groups are largely overlapped. Partial least squares discriminant analysis and unpaired Student’s t-test were used. All statistical tests were two-sided. f, The heat map shows the overlapped upregulated metabolites in (e). Experiments were repeated twice independently with similar results. Source data
Extended Data Fig. 4
Extended Data Fig. 4. 4HPAA, 3HPP, and 4HPP alleviate adipocyte hypertrophy and hepatic steatosis.
a, Representative images of H&E-stained adipose tissue sections, including iBAT, iWAT, and eWAT, from ND/HFD-fed mice orally treated with or without 4HPAA, 4HPP, 3HPP, and tyrosol on the 10th week of treatment. Scale bars represent 100 μm. b, Serum biomarkers (ALT, AST, TC, LDL-C, and HDL-C) in ND-fed mice (n = 5) and HFD-fed mice orally treated with normal water (n = 14) or water supplemented with 4HPAA (n = 15), 3HPP (n = 12), 4HPP (n = 13), and tyrosol (n = 15) were measured and plotted. Error bars indicate mean ± SEM, two-tailed Mann-Whitney test. Experiments were repeated twice independently with similar results. Source data
Extended Data Fig. 5
Extended Data Fig. 5. Metabolic and behavior performances of mice treated with 4HPAA.
a-b, Blood glucose was measured from mouse tail blood samples for the OGTT (b) and ITT (b). Data are presented as mean ± SD, n = 6 mice per group. Statistical analysis was performed using the two-tailed Mann-Whitney test. c-e, Behavior tests for ND-fed mice treated with or without 4HPAA. No overt behavioral differences were observed in the elevated plus maze (c), open field test (d), and Y-maze (e) (n = 6 mice per group). Error bars indicate mean ± SEM, n = 6 mice per group (except for the control in open field test, n = 5), two-tailed Mann-Whitney test. Experiments were repeated twice independently with similar results. Source data
Extended Data Fig. 6
Extended Data Fig. 6. 4HPAA, 4HPP, and 3HPP target intestines to maximize anti-obesity effects.
a, Representative images of H&E-stained adipose tissues, including iBAT, iWAT, and eWAT, from ND/HFD-fed mice IP injected with saline, 4HPAA, and 3HPP for 12 weeks. b, Box and whisker plots showing the measured LDL-C and TC in HFD-fed mice IP injected with 4HPAA (n = 6), 3HPP (n = 7), or saline (n = 3). The maxima, upper quartiles, medians, lower quartiles, and minima are shown. c, The triglyceride concentrations in the 3T3L1-derived adipocytes after 4HPAA, 3HPP, or 4HPP treatment, respectively (n = 5 per group). d, The 4HPAA concentrations in the contents of the jejunum, ileum, cecum, and colon (feces), as well as in the serum of mice after a seven-day 4HPAA feeding were measured and shown. For fecal samples, n = 10 mice per group. For other samples, n = 6 (control) or n = 8 (4HPAA-fed) mice per group. e, The gray-shaded section represents the proportion of each bacterial family in the gut microbiota before treatment with small molecules, while the white-shaded section shows the change in the proportion of the specific bacterial family after one month of treatment (n = 3 for ND group, n = 6 for other groups). For b-e, error bars indicate mean ± SEM, statistical analysis was assessed by the two-tailed Mann-Whitney test. Experiments in a-d were repeated twice independently with similar results. Source data
Extended Data Fig. 7
Extended Data Fig. 7. Transcriptomics analysis of mouse colons in mice treated with and without 4HPAA.
a, The heat maps display a total of 42 upregulated genes and 64 downregulated genes. Genes related to lipid absorption and metabolism are marked with blue labels and the B cell immunity-related genes are marked with red labels. b, RT-PCR analysis shows that the colonic transcription of Cd36 and Scd1 was drastically inhibited in the 4HPAA-fed (for 3 months) mice compared to control mice (n = 5 mice per group). c, Representative DIC images of the mouse small intestinal (SI) organoids treated with or without 100 μM 4HPAA and 3HPP for 3 days. The scale bar represents 100 μm. d, The Cd36, Scd1, and Aqp7 transcripts from the organoids in (c) were quantified by RT-qPCR (n = 4 for the mock group and n = 3 for other groups). For b and d, error bars indicate mean ± SEM, two-tailed Mann-Whitney test, experiments were repeated twice independently with similar results. Source data
Extended Data Fig. 8
Extended Data Fig. 8. 4HPAA treatment reduces chronic inflammation in gut and serum.
a, Measured B cell compartments in the colons of tested mice over time. For measurement at day 3, 6, and 11, n = 2 mice per group; for day 14, 18, and 20, n = 4 mice per group; for day 16, n = 6 mice per group. b, Representative flow plots of the B cell compartment in the colons of HFD-fed mice treated with or without 4HPAA on the day 16. c, Quantification of percentages of B cell compartments on 16th days (n = 6 mice per group). d-e, Transcription of lipid absorption genes, including Cd36 and Scd1 in the colonic (d) and small intestinal (e) epithelia of tested mice after one month treatment (n = 6 mice per group). f, Serum concentrations of individual cytokines in HFD-fed mice treated with or without 4HPAA (n = 6 mice per group). For a, c, d, and e, error bars indicate mean ± SD, two-tailed Mann-Whitney test. For f, error bars indicate mean ± SEM, two-tailed Student’s t-test. All experiments were repeated twice independently with similar results. Source data
Extended Data Fig. 9
Extended Data Fig. 9. Compartments of B cells, T cells, Macrophages, DCs, NKs, and ILCs in mouse colons.
a, Frequency of memory B (n = 7 mice per group), follicular B (n = 7), CD4+ T (n = 8), CD8+ T (n = 8), Th17 (n = 4), Treg (n = 4), ILC1 (n = 5), ILC2 (n = 5), and ILC3 (n = 5) cell populations in the colon of HFD-fed mice treated with or without 4HPAA on day 16. Error bars indicate mean ± SEM, two-tailed Mann-Whitney test. b, Representative images of flow cytometric plots of B cells (CD45+B220+), follicular B cells (CD45+B220+IgACD21+CD23+), memory B cells (CD45+B220+IgACD38+GL7IgMIgD), T cells (CD45+CD3+), CD4+ T (CD45+CD3+CD4+CD8), CD8+ T (CD45+CD3+CD8+CD4), Th17 cells (CD45+CD3+CD4+CD8FOXP3RORγt+), Tregs (CD45+CD3+CD4+CD8FOXP3+), NK cells (CD45+CD3NK1.1+), ILC cells (CD45+LinCD90.2+), ILC1 (CD45+LinCD90.2+KLRG1RORγT), ILC2 (CD45+LinCD90.2+KLRG1+RORγT), ILC3 (CD45+LinCD90.2+RORγT+KLRG1), DCs (CD45+CD11c+MHCII+CD64), and Macrophages (CD45+CD11b+CD64+ SiglecF). Source data
Extended Data Fig. 10
Extended Data Fig. 10. Compartments of subtypes of ILCs and T cells in mouse small intestines.
a, Representative frequency of total ILCs, ILC1, ILC2, ILC3, CD4+ T cells, CD8+ T cells populations in the colon of HFD-fed mice treated with or without 4HPAA on day 16. Error bars indicate mean ± SEM, n = 5 mice per group, two-tailed Mann-Whitney test. Experiments were repeated twice with similar results. b, Flow cytometric analysis of ILC cells (CD45+LinCD90.2+), ILC1 (CD45+LinCD90.2+KLRG1 RORγT), ILC2 (CD45+Lin CD90.2+KLRG1+RORγT), ILC3 (CD45+LinCD90.2+RORγT+ KLRG1), CD4+ T (CD45+CD3+CD4+CD8), CD8+ T (CD45+CD3+CD8+CD4) populations. Source data

References

    1. Afshin, A. et al. Health effects of overweight and obesity in 195 countries over 25 years. N. Engl. J. Med.377, 13–27 (2017). - PMC - PubMed
    1. Twig, G. et al. Body-mass index in 2.3 Million adolescents and cardiovascular death in adulthood. N. Engl. J. Med.374, 2430–2440 (2016). - PubMed
    1. Bjerregaard, L. G. et al. Change in overweight from childhood to early adulthood and risk of type 2 diabetes. N. Engl. J. Med.378, 1302–1312 (2018). - PubMed
    1. Wearing, S. C., Hennig, E. M., Byrne, N. M., Steele, J. R. & Hills, A. P. Musculoskeletal disorders associated with obesity: a biomechanical perspective. Obes. Rev.7, 239–250 (2006). - PubMed
    1. Avgerinos, K. I., Spyrou, N., Mantzoros, C. S. & Dalamaga, M. Obesity and cancer risk: emerging biological mechanisms and perspectives. Metabolism92, 121–135 (2019). - PubMed

LinkOut - more resources