. 2025 May;31(5):1635-1643.
doi: 10.1038/s41591-025-03563-4. Epub 2025 Mar 14.

Social disadvantage accelerates aging

Affiliations

Social disadvantage accelerates aging

Mika Kivimäki et al. Nat Med. 2025 May.

Abstract

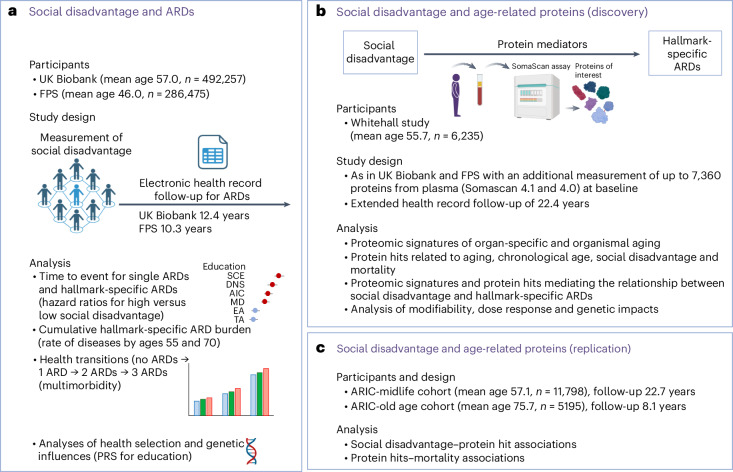
Social disadvantage, like advanced age, is a risk factor for a broad range of health conditions; however, whether it influences the aging process remains unclear. Here, using a multicohort approach, we investigated the associations of social disadvantage with age-related plasma proteins and age-related diseases. We found proteomic signatures of accelerated immune aging and 14 specific age-related proteins linked to social disadvantage during both early and later life. Individuals experiencing social disadvantage had an increased risk of 66 age-related diseases, with up to 39% of these associations mediated by the 14 age-related proteins (for example, DNAJB9, F2, HSPA1A, BGN). The main enriched pathway involved the upregulation of the pro-inflammatory regulator NF-κB24 and its downstream factor interleukin-8. Our findings support the hypothesis that social disadvantage throughout the life course may accelerate aging, a biological mechanism that could explain why social stratification plays such a fundamental role in determining human health.


Conflict of interest statement

Competing interests: T.W-C. has filed a patent application related to proteomic organ aging, is a co-founder and scientific advisor of Teal Omics Inc. and has received equity stakes. T.W.-C. is also a co-founder and scientific advisor of Alkahest Inc. and Qinotto Inc. and has received equity stakes in these companies. The other authors declare no competing interests.

Figures

Fig. 1
Fig. 1. Overview of the study design.
a, Summary of study characteristics and analyses from the UK Biobank and the FPS. Indicators of social disadvantage were education and adulthood SES, measured by residential neighborhood deprivation and occupational position. In individuals with social disadvantage, a higher risk of ARDs was observed across all nine hallmarks of aging. This was evident for the onset of the first ARD, cumulative ARD burden and ARD multimorbidity. By contrast, there was limited evidence for the reverse direction of the relationship, in which ARDs lead to social disadvantage, or for genetic factors explaining the observed associations. b, The characteristics and analyses of the Whitehall study, including proteomic data, are summarized. With the exception of immune function and kidney aging, proteomic signatures of organ-specific aging were not strongly associated with social disadvantage. By contrast, of the 1,040 hallmark-related proteins associated with chronological age at proteome-wide significance, 14 were consistently linked to indicators of social disadvantage and hallmark-specific ARDs, partially mediating this association. Additional analyses supported the modifiability of these proteins in relation to changes in social disadvantage and a dose–response association indicating accumulated risk. c, Characteristics and analyses of the two cohorts of the ARIC study, including data on 11 of the 14 proteins, are summarized. The associations between social disadvantage and protein levels replicated the findings from the Whitehall study. Similarly, the longitudinal associations between these proteins and all-cause mortality, with both 23-year and shorter 8-year follow-ups, were consistent with those observed in Whitehall. Figure created with BioRender.com.
Fig. 2
Fig. 2. Social disadvantage and risk of diseases associated with hallmarks of aging.
These analyses examine the social causation hypothesis using two-sided tests without adjustments for multiple comparisons (for full results, see Supplementary Tables 3–12). The whiskers represent 95% CIs. a, The numbers indicate hazard ratios from Cox proportional hazards models comparing high versus low social disadvantage at baseline (education and adulthood SES), adjusted for age, sex and ethnicity, for a single ARD risk at follow-up in the UK Biobank and FPS (sample size 481,197–492,257 in the UK Biobank and 275,157–285,830 in the FPS, depending on the social disadvantage indicator and ARD). All HRs are statistically significant (P < 0.05). Only the 30 strongest associations are shown. b, The forest plot shows hazard ratios from Cox models for developing hallmark-specific ARDs, comparing participants with high versus low social disadvantage in a population free of these diseases at baseline. All HRs are statistically significant (P < 0.05). In the UK Biobank, sample sizes ranged from 430,373 to 460,980, with the corresponding FPS sample sizes between 257,073 and 281,348. c, The bars show the number and 95% CIs of hallmark-specific ARDs per 100 person-years by age 70 in the UK Biobank, stratified by social disadvantage level, estimated using Poisson regression (range of person-years 34,134,089–34,174,830). The results for FPS are available in Supplementary Table 7 (range of person-years 15,508,103–16,112,263). d, The bars represent ARD multimorbidity progression rates, from an ARD-free state to three co-occurring ARDs, stratified by social disadvantage levels, based on Poisson regression analysis in a population free of these diseases at baseline (range of person-years 4,959,308–4,965,499 in UK Biobank and 2,614,663–2,712,578 in FPS). HR, hazard ratio; Educ, education. Source data
Fig. 3
Fig. 3. Plasma proteins associated with social disadvantage and risk of hallmark-specific ARDs and mortality.
a,b, Findings from the Whitehall study; full results are in Supplementary Tables 15–24. a, The heat map shows results from multinomial logistic regression analyses examining the associations between social disadvantage and protein signatures of age gaps defined as the biological age of an individual’s organs or body relative to that of same-aged peers. The numbers represent beta coefficients for low versus high education and neighborhood deprivation, adjusted for age, sex and ethnicity. b, Of the 1,040 proteins with concentrations significantly associated with chronological age at the proteome-wide level (two-sided P < 1.67 × 10−6), 14 proteins are highlighted for their consistent associations with age (linear regression analysis), social disadvantage indicators (cumulative logistic regression analysis) and mortality (Cox regression). The numbers in the upper heat maps show beta coefficients and hazard ratios per s.d. increase in protein concentration, from linear regression for social disadvantage and Cox regression for ARDs, adjusted for age, sex and ethnicity. The lower heat map shows the proportion of the association between social disadvantage and hallmark-specific ARDs mediated by the 14 proteins, calculated using the inverse odds ratio-weighted method. c, GO enrichment analyses of the 14 proteins are shown. Rows show the GO terms, the dot sizes show the number of enriched proteins, the colors indicate the FDR-adjusted P value and the x axis shows the proportion of enriched proteins relative to all proteins associated with the GO term. d, String protein interaction network analysis indicates that 7 of the 14 proteins formed a protein interaction network. Only associations above a confidence score of 0.4 (standard medium confidence) are shown. Source data
Fig. 4
Fig. 4. Supplementary and replication analyses for the associations between social disadvantage, protein concentrations, ARDs and mortality.
These results from analyses examining the social causation hypothesis are based on two-sided tests, without adjustment for multiple testing (for full results, see Supplementary Tables 25–30). a, The y axis shows age-, sex- and ethnicity-adjusted means of standardized protein concentrations by combinations of early- and later-life social disadvantage categories, measured by education and adult SES in the Whitehall study. Supporting modifiability, a reduction in social disadvantage was associated with more favorable protein concentrations in later life, compared with persistent social disadvantage. Conversely, the onset of social disadvantage was linked to less favorable protein concentrations, compared with remaining free from disadvantage. b, The left panel shows adjusted means of standardized protein concentrations across a life-course social standing score (range: 2–6), illustrating dose–response associations: a higher social standing corresponds to more favorable protein concentrations, while lower scores indicate less favorable concentrations. The right panel shows cumulative hazard curves for ARDs during follow-up, stratified by baseline life-course social standing scores. Curve separation by social standing scores, derived from cumulative logistic regression, became apparent after baseline and widened over the 20-year follow-up. The incidence of ARD observed in individuals with the highest social standing score at follow-up year 20 was reached 5.3 years earlier in those with the lowest score. c, Age-, sex- and ethnicity-adjusted β coefficients from cumulative logistic regression analysis for the 11 proteins available in the ARIC study confirmed the associations with social disadvantage observed in the Whitehall study when analyzing midlife protein concentrations. With two exceptions, these associations were also evident in the analysis of protein levels measured in old age. d, The forest plot shows age-, sex- and ethnicity-adjusted hazard ratios per 1 s.d. higher protein concentration for mortality, based on Cox proportional hazards regression analyses. The whiskers represent 95% CIs. Source data
Extended Data Fig. 1
Fig. 1. Sample selection for the cohorts in the primary analysis. Source data
Extended Data Fig. 2
Fig. 2 Sample selection for the cohorts in the replication study. Source data
Extended Data Fig. 3
Extended Data Fig. 3. Fig. 3. Barrat Global Network Transitivity Analysis of disease associations in hallmark-specific ARDs (source: Kivimaki et al. Lancet Healthy Longevity 2024).
Data are from the UK Biobank study (total N = 492,257). Number in parenthesis is clustering coefficient. Circle size is proportional to the occurrence of the disease. AIC, altered intercellular communication; ARD, age-related disease; CS, cellular senescence; DNS, deregulated nutrient sensing; EA, epigenetic alterations; GI, genomic instability; LOP, loss of proteostasis; MD, mitochondrial dysfunction; SCE, stem cell exhaustion; TA, telomere attrition.
Extended Data Fig. 4
Extended Data Fig. 4. Fig. 4. Correlation matrix for hallmark-specific ARDs in the UK Biobank and the Finnish Public Sector studies.
Numbers are Phi coefficients of bivariate correlations between hallmark-specific ARDs in the UK Biobank (total N = 492,257) and Finnish Public Sector (total N = 286,475) studies. AIC, altered intercellular communication; ARD, age-related disease; CS, cellular senescence; DNS, deregulated nutrient sensing; EA, epigenetic ageing; FPS, Finnish Public Sector study; GI, genomic instability; LOP, loss of proteostasis; MD, mitochondrial dysfunction; SCE, stem cell exhaustion; TA, telomere attrition. Source data
Extended Data Fig. 5
Extended Data Fig. 5. Fig. 5. Cox proportional hazards regression analysis of social disadvantage and risk of single hallmark-specific ARDs.
Numbers represent the range of statistically significant age-, sex-, and ethnicity-adjusted hazard ratios for high versus low social disadvantage (education, neighbourhood deprivation, occupational position) in relation to specific ARDs in the UK Biobank (N = 492,257) and the Finnish Public Sector study (N = 286,475). These ranges reflect associations where ARDs are linked exclusively to a single compensatory/integrative hallmark or a single primary hallmark of aging. Full results for all social disadvantage-ARD associations are available in Supplementary Table 3. AIC, altered intercellular communication; ARD, age-related disease; CS, cellular senescence; DNS, deregulated nutrient sensing; EA, epigenetic ageing; GI, genomic instability; HR, hazard ratio; LOP, loss of proteostasis; MD, mitochondrial dysfunction; SCE, stem cell exhaustion; TA, telomere attrition. Source data
Extended Data Fig. 6
Extended Data Fig. 6. Fig 6. Time-to-event analysis for social disadvantage and developing the first hallmark-specific ARDs in participants with no such diseases at the time social disadvantage was measured.
Data are from the UK Biobank and the Finnish Public Sector study. The plots show the age-, sex- and ethnicity-adjusted hazard ratios for hallmark-specific ARDs in participants with high versus low social disadvantage, based on Cox proportional hazards regression analysis. Whiskers show 95% confidence interval for these estimates. AIC, altered intercellular communication; ARD, age-related disease; CS, cellular senescence; DNS, deregulated nutrient sensing; EA, epigenetic ageing; FPS, Finnish Public Sector study; GI, genomic instability; HR, hazard ratio; LOP, loss of proteostasis; MD, mitochondrial dysfunction; SCE, stem cell exhaustion; TA, telomere attrition. Source data
Extended Data Fig. 7
Extended Data Fig. 7. Fig. 7. Cross-sectional associations between indicators of social disadvantage and plasma proteomic signatures of organ-specific and organismal (non-organ-specific) age gaps.
Data are from the Whitehall study. The plots display the odds ratios for low vs high social disadvantage from multinomial logistic regression analyses for organ-specific and organismal age gaps, defined as the biological age of an individual’s organs or body relative to that of same-aged peers. Whiskers show 95% confidence interval for these estimates. Source data
Extended Data Fig. 8
Extended Data Fig. 8. Fig. 8. Biological processes associated with the 14 mediator proteins linking social disadvantage and hallmark-specific ARDs, as identified from the Universal Protein Resource (UniProt, a comprehensive, freely accessible database of protein sequence and functional information).
UniProt descriptions of biological processes for mediator proteins of the associations between social disadvantage and hallmark-specific diseases. Source data

References

    1. Stringhini, S. et al. Socioeconomic status and the 25 × 25 risk factors as determinants of premature mortality: a multicohort study and meta-analysis of 1.7 million men and women. Lancet389, 1229–1237 (2017). - PMC - PubMed
    1. Snyder-Mackler, N. et al. Social determinants of health and survival in humans and other animals. Science368, eaax9553 (2020). - PMC - PubMed
    1. Kivimaki, M. et al. Association between socioeconomic status and the development of mental and physical health conditions in adulthood: a multi-cohort study. Lancet Public Health5, e140–e149 (2020). - PubMed
    1. Fraser, H. C. et al. Biological mechanisms of aging predict age-related disease co-occurrence in patients. Aging Cell21, e13524 (2022). - PMC - PubMed
    1. Lopez-Otin, C., Blasco, M. A., Partridge, L., Serrano, M. & Kroemer, G. The hallmarks of aging. Cell153, 1194–1217 (2013). - PMC - PubMed