. 2025 Mar;57(3):686-699.
doi: 10.1038/s12276-025-01422-3. Epub 2025 Mar 14.

Generation of hypoimmunogenic universal iPS cells through HLA-type gene knockout

Affiliations

Generation of hypoimmunogenic universal iPS cells through HLA-type gene knockout

Juryun Kim et al. Exp Mol Med. 2025 Mar.

Abstract

Hypoimmunogenic universal induced pluripotent stemn (iPS) cells were generated through the targeted disruption of key genes, including human leukocyte antigen (HLA)-A, HLA-B and HLA-DR alpha (DRA), using the CRISPR-Cas9 system. This approach aimed to minimize immune recognition and enhance the potential of iPS cells for allogeneic therapy. Heterozygous iPS cells were used for guide RNA design and validation to facilitate the knockout (KO) of the HLA-A, HLA-B and HLA-DRA genes. The electroporation of iPS cells using the selected guide RNAs enabled the generation of triple-KO iPS cells, followed by single-cell cloning for clone selection. Clone A7, an iPS cell with targeted KOs of the HLA-A, HLA-B and HLA-DRA genes, was identified as the final candidate. Messenger RNA analysis revealed robust expression of pluripotency markers, such as octamer-binding transcription factor 4, sex-determining region Y box 2, Krüppel-like factor 4, Lin-28 homolog A and Nanog homeobox, while protein expression assays confirmed the presence of octamer-binding transcription factor 4, stage-specific embryonic antigen 4, Nanog homeobox and tumor rejection antigen 1-60. A karyotype examination revealed no anomalies, and three-germ layer differentiation assays confirmed the differentiation potential. After interferon gamma stimulation, the gene-corrected clone A7 lacked HLA-A, HLA-B and HLA-DR protein expression. Immunogenicity testing further confirmed the hypoimmunogenicity of clone A7, which was evidenced by the absence of proliferation in central memory T cells and effector memory T cells. In conclusion, clone A7, a triple-KO iPS cell clone that demonstrates immune evasion properties, retained its intrinsic iPS cell characteristics and exhibited no immunogenicity.


Conflict of interest statement

Competing interests: The authors declare no competing interests.

Figures
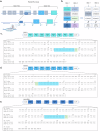
Fig. 1
Fig. 1. Design of triple-HLA-gene-KO iPS cells.
a, A scheme of triple-HLA-gene-KO iPS cells. b, A strategy scheme of the HLA type of YiP3 iPS cells. ce, Exon 2 nucleotide sequences of HLA-A (c), HLA-B (d) and HLA-DRA (e) for YiP3 iPS cells are displayed in codons. The blue part of the sequence represents the gRNA region, and the green part represents the protospacer adjacent motif (PAM) site. The nucleotide sequence is displayed using the sequence alignment tool in the immune polymorphism database-international immunogenetics information system/human leukocyte antigen (IPD-IMGT/HLA) database.
Fig. 2
Fig. 2. Assessment of gRNAs in iPS cells and confirmation of triple-HLA-gene-KO iPS cells.
a, A scheme of gRNA assessment in iPS cells. This illustration was created using bioRender. b, The Sanger sequence images and inference of CRISPR edits (ICE) analysis demonstrating the efficiency of two candidate gRNAs per HLA-A gene. c, The Sanger sequencing images and ICE analysis demonstrating the efficiency of two candidate gRNAs per HLA-B gene. d, Sanger sequence images and ICE analysis demonstrating the efficiency of two candidate gRNAs per HLA-DRA gene. e, A schematic representation of the single-clone selection process for iPS cells in which HLA-A, HLA-B and HLA-DRA were knocked out. This illustration was created using bioRender. f, The Sanger sequencing images demonstrating the KO of the HLA-A, HLA-B and HLA-DRA genes in the YiP3 iPS cell line. A7 and B2 represent KO clones, with each clone demonstrating the KO of the HLA-A and HLA-B genes, respectively, while the HLA-DRA gene is also knocked out.
Fig. 3
Fig. 3. Assessment of the characteristics of engineered iPS cells.
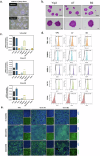
a, A microscopy image of iPS cells and clones A7 and B2 with HLA-A, HLA-B and HLA-DRA knocked out. Scale bars, 500 μm. b, Alkaline phosphatase (AP) staining image of iPS cells, YiP3 and clones A7 and B2. Scale bars, 500 μm. c, Real-time PCR data for the pluripotency markers, such as OCT4, SOX2, KLF4, LIN28 and NANOG, and three-germ layer differentiation markers, such as SOX17, BRACHYURY and PAX6, in YiP3 and clones A7 and B2. d, Flow cytometry data for pluripotency markers, such as tumor rejection antigen 1-60 (TRA-1-60), NANOG, stage-specific embryonic antigen 1 (SSEA4), OCT4 and the negative marker CD34 in YiP3 and clones A7 and B2. e, The immunocytochemistry images demonstrating the expression of markers (PAX6) for ectoderm, (BRACHYURY) for mesoderm and (SOX17) for endoderm, and 4',6-diamidino-2-phenylindole (DAPI) for nuclear staining following differentiation into the three germ layers using YiP3 and clones A7 and B2. Scale bars, 200 μm.
Fig. 4
Fig. 4. Assessment of HLA gene and protein expression.
a, Real-time PCR data showing the mRNA expression levels of HLA-A, HLA-B and HLA-DRA in YiP3 and clones A7 and B2. Top: the relative mRNA expression in delta cycle threshold (dCt) values. Bottom: a graph normalized to glyceraldehyde 3-phosphate dehydrogenase (GAPDH), with YiP3 used as the reference value. The statistical significance is indicated by the P value (analysis of variance (ANOVA) test) versus YiP3: *P < 0.05, **P < 0.01 and ***P < 0.001. b, The flow cytometry data demonstrate alterations in the expression levels of HLA-A, HLA-B and HLA-DR in YiP3 and clones A7 and B2 iPS cells before and after stimulation with IFN-γ. The histograms represented by the lines depict the cell populations before IFN-γ stimulation, whereas those shaded in cyan represent the cell populations after IFN-γ stimulation.
Fig. 5
Fig. 5. Assessment of the genetic stability of HLA-triple-KO iPS cells in clones A7 and B2.
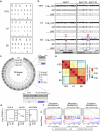
a, Karyotype analysis of YiP3 iPS cells and HLA-triple-KO iPS cells in clones A7 and B2. b, Identification of copy number (CN) losses in clone B2. CN losses at the 2q22.1 (138.17–138.82 Mbp on chromosome 2) and 6p21.33–6p21.32 (31.32–32.41 Mbp on chromosome 6) loci were identified through high-resolution single-nucleotide polymorphism (SNP) genotyping using the CytoScan HD array. AD: allele difference, BAF: B allele frequency. c, Identification of CRISPR–Cas9 off-target effects induced by three gRNAs in clones A7 and B2. In the Circos plot, the first layer represents all human chromosomes (Chr). The second layer represents off-target sites (Predict Off; black color bar) in the human reference genome predicted by Cas-OFFinder, facilitating two mismatches. The third layer represents off-targets (Obs. Off), such as SNVs or insertions and/or deletions (InDels), as observed from whole-genome sequence (WGS) data of clones B2 (green color bar) and A7 (red color bar). The fourth layer represents structural variants (obs. SV) related to on- and/or off-target activity detected from WGS data of clones B2 (green color bar) and A7 (red color bar). In clone A7, an SV event is detected: a 28-bp deletion in HLA-A. In clone B2, three SV events are detected: a 34-bp insertion in HLA-A and CN losses at two loci, 2q22.1 (encompassing THSD7B to HNMT) and 6p21.33–6p21.32 (encompassing HLA-B and HLA-DRA). d, The expression of the targeted genes HLA-A, HLA-B, and HLA-DRA in YiP3 and clones A7 and B2. e, Gene expression correlations among YiP3, A7 and B2. f, An enrichment plot for endoderm (GO: 0007492), mesoderm (GO: 0007498) and ectoderm (GO: 0007398) development. The plot shows the running enrichment score (ES) for the gene set (top) as the analysis continues down the ranked list (middle).
Fig. 6
Fig. 6. Immunogenicity test for triple-KO engineered iPS cells under IFN-γ stimulation.
a, A schematic representation of the process of the in vitro immunogenicity test for YiP3 and clones A7 and B2. This illustration was created using bioRender. b, The HLA type of YiP3 and the HLA type of PBMC donor used in the immunogenicity test for YiP3 differ from the HLA type of YiP3. c, The histograms from flow cytometry depict the proliferation of CFSE-stained T cells and T cell-depleted donor PBMCs cocultured with YiP3 and clones A7 and B2. CFSE-labeled T cells represent TCMs (left), whereas CFSE-labeled T cells (right) represent TEMs. The proliferation levels of TCMs and TEMs were measured on days 7, 14 and 21. d, The data on CD4+ T cell proliferation percentages obtained from flow cytometry. Left: the extent of proliferation of CD4+ TCMs from YiP3 and clones A7 and B2 on days 7, 14 and 21. Right: the extent of proliferation of CD4+ TCM from YiP3 and clones A7 and B2 on days 7, 14 and 21. The statistical significance is indicated by the P value (analysis of variance (ANOVA) test) versus YiP3: *P < 0.05, **P < 0.01 and ***P < 0.001. e, The HLA type of NK cell donor used in the NK cell activity test for YiP3. f, A CD107a assay to detect CD107a-positive NK cells reacting to the YiP3, A7 and B2 iPS cell lines. CD107a expression was measured by flow cytometry after incubating YiP3, A7 and B2 cells with NK cells isolated from donor B. g, The quantification data of CD107a+ NK cells obtained by flow cytometry. The statistical significance is indicated by the P value (ANOVA) test) versus YiP3: *P < 0.05 and **P < 0.01.
Fig. 7
Fig. 7. Assessment of endothelial differentiation capability and validation of HLA protein expression in triple-HLA-KO iPS-cell-derived ECs.
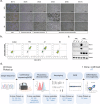
a, Microscopy images after EC differentiation using YiP3 and clones A7 and B2. Scale bars, 500 μm. b, Flow cytometry data showing the cell population expressing the EC markers CD31 and VE-cadherin after EC differentiation of YiP3 and clones A7 and B2. c, The western blotting data showing alterations in the protein expression levels of HLA-A, HLA-B and HLA-C before and after IFN-γ stimulation after EC differentiation of YiP3 and clones A7 and B2. d, A schematic diagram illustrating the process of selecting triple-KO clones for HLA-A, HLA-B and HLA-DRA after gene correction. This illustration was created using bioRender.

References

    1. Thanaskody, K. et al. MSCs vs. iPS cells: potential in therapeutic applications. Front. Cell Dev. Biol.10, 1005926 (2022). - PMC - PubMed
    1. Takahashi, K. et al. Induction of pluripotent stem cells from adult human fibroblasts by defined factors. Cell131, 861–872 (2007). - PubMed
    1. Bellin, M., Marchetto, M. C., Gage, F. H. & Mummery, C. L. Induced pluripotent stem cells: the new patient? Nat. Rev. Mol. Cell Biol.13, 713–726 (2012). - PubMed
    1. Liu, X., Li, W., Fu, X. & Xu, Y. The immunogenicity and immune tolerance of pluripotent stem cell derivatives. Front. Immunol.8, 645 (2017). - PMC - PubMed
    1. Montgomery, R. A., Tatapudi, V. S., Leffell, M. S. & Zachary, A. A. HLA in transplantation. Nat. Rev. Nephrol.14, 558–570 (2018). - PubMed

MeSH terms

LinkOut - more resources