. 2025 Mar 15;13(1):61.
doi: 10.1186/s40478-025-01961-w.

Metabolic profiling of adult and pediatric gliomas reveals enriched glucose availability in pediatric gliomas and increased fatty acid oxidation in adult gliomas

Affiliations

Metabolic profiling of adult and pediatric gliomas reveals enriched glucose availability in pediatric gliomas and increased fatty acid oxidation in adult gliomas

Vladislav O Sviderskiy et al. Acta Neuropathol Commun. .

Abstract

Gliomas are the most common primary brain tumors and a major source of mortality and morbidity in adults and children. Recent genomic studies have identified multiple molecular subtypes; however metabolic characterization of these tumors has thus far been limited. We performed metabolic profiling of 114 adult and pediatric primary gliomas and integrated metabolomic data with transcriptomics and DNA methylation classes. We identified that pediatric tumors have higher levels of glucose and reduced lactate compared to adult tumors regardless of underlying genetics or grade, suggesting differences in availability of glucose and/or utilization of glucose for downstream pathways. Differences in glucose utilization in pediatric gliomas may be facilitated through overexpression of SLC2A4, which encodes the insulin-stimulated glucose transporter GLUT4. Transcriptomic comparison of adult and pediatric tumors suggests that adult tumors may have limited access to glucose and experience more hypoxia, which is supported by enrichment of lactate, 2-hydroxyglutarate (2-HG), even in isocitrate dehydrogenase (IDH) wild-type tumors, and 3-hydroxybutyrate, a ketone body that is produced by oxidation of fatty acids and ketogenic amino acids during periods of glucose scarcity. Our data support adult tumors relying more on fatty acid oxidation, as they have an abundance of acyl carnitines compared to pediatric tumors and have significant enrichment of transcripts needed for oxidative phosphorylation. Our findings suggest striking differences exist in the metabolism of pediatric and adult gliomas, which can provide new insight into metabolic vulnerabilities for therapy.

Keywords: Adult glioma; Fatty acid oxidation; Glucose; H3 mutant; Metabolic profiling; Pediatric glioma.


Conflict of interest statement

Declarations. Ethics approval and consent to participate: All tumors were collected upon obtaining informed consent approved by Institutional Review Board (IRB#: S12-00865). Consent for publication: Not applicable. Competing interests: M.S. is scientific advisor and shareholder of Heidelberg Epignostix and Halo Dx, and a scientific advisor of Arima Genomics, and InnoSIGN and received research funding from Lilly USA. Other authors declare no conflict of interest.

Figures
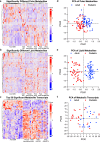
Fig. 1
Fig. 1
Metabolic Differences Between Adult and Pediatric Gliomas. (a and b) Heatmap reporting the relative abundance of significantly enriched (FDR < 0.05) polar (a) and lipid (b) metabolites in adult or pediatric gliomas after normalization of batch corrected data. Metabolites presented in order of hierarchal clustering results (left). Samples are grouped by subtype (bottom). The scale bar (right) denotes the Z-score relative to the mean for each metabolite. c Heatmap reporting the relative abundance of the top 50 significantly enriched metabolic transcripts in adult or pediatric gliomas (FDR < 0.05). Transcripts presented in order of hierarchal clustering results. Samples are grouped by subtype (bottom). The scale bar (right) denotes the Z-score relative to the mean for each transcript. (d-f) PCA of normalized batch corrected polar (d) and lipid (e) metabolite data and transcriptomic (f) data. Graphs created using PCA1 and PCA2. Adult samples are depicted in blue and pediatric samples are depicted in red.* Detailed sample and subgroup information can be found in Methods and Supplementary Table 1. Supplementary Fig. 1 has polar (a) and lipid (b) data subdividing each sample for per the samples subgroup
Fig. 2
Fig. 2
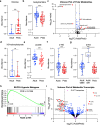
Pediatric Gliomas are Enriched in Glucose Whereas Adult Tumors have Hallmarks of a Hypoxic Microenvironment. a, b, dg Relative abundance of glucose (a), acetylcarnitine (b), 3-hydroxybutyrate (d), lactate (e), and 2-hydroxyglutarate (f and g) in individual adult (blue) and pediatric tumors (Peds, red) using the batch corrected data normalized across all samples. ** denotes p < 0.01, *** denotes p < 0.001. c, i Volcano plot depicting significance (-log10(p-value) and relative abundance in adult versus pediatric samples (log2FC) for each polar metabolite (c) or metabolic transcript (i). Dashed lines denote cut-offs for significance (horizontal, FDR < 0.05) and enrichment (vertical, log2FC > 0.5 or < -0.5 for polar metabolites and > 2 or < -2 for metabolic transcripts). Metabolites or transcripts with significance and enrichment are in red, significance only in blue, enrichment only in gray, and neither in black. Purple in (i) denotes GLUT transporters. h Output of GSEA analysis for Buffa Hypoxia Metagene. Input is ranked fold change of transcripts in adult relative to pediatric gliomas. The green line denotes enrichment score along the ranked gene set. Black lines denote locations of genes in the gene set within this ranked list. FDR values are indicated
Fig. 3
Fig. 3
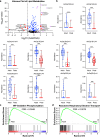
Adult Gliomas have Increased Levels of Acylcarnitines and Hallmarks of Increased OXPHOS. a Volcano plot depicting significance (-log10(p-value) and relative abundance in adult versus pediatric samples (log2FC) for each lipid metabolite. Dashed lines denote cut-offs for significance (horizontal, FDR < 0.05) and enrichment (vertical, log2FC > 2 or < -2). Metabolites with significance and enrichment are in red, significance only in blue, enrichment only in gray, and neither in black. Purple denotes acylcarnitines. b Relative abundance of indicated acylcarnitines in individual adult (blue) and pediatric (Peds, red) tumors using the batch corrected data normalized across all samples. *** denotes p < 0.001. (c and d) Output of GSEA analysis for WP Oxidative Phosphorylation (c) and Reactome Respiratory Electron Transport (d) gene sets. Input is ranked fold change of transcripts in adult relative to pediatric tumors. The green line denotes enrichment score along the ranked gene set. Black lines denote locations of genes in the gene set within this ranked list. FDR values are indicated
Fig. 4
Fig. 4
Differences in Glucose and Fatty Acid Metabolism Between Adult and Pediatric Gliomas are Independent of Tumor Grade. a and b Heatmap reporting the relative abundance of significantly enriched (FDR < 0.05) polar (a) and lipid (b) metabolites in adult IDH wild-type glioblastoma (Adult GBM) or pediatric high grade H3 K27M or G34V mutant gliomas (Peds HGG-H3) after normalization of batch corrected data. Metabolites presented in order of hierarchal clustering results (left). Samples are grouped by subtype (bottom). The scale bar (right) denotes the Z-score relative to the mean for each metabolite. (c and d) PCA of normalized batch corrected polar (c) and lipid (d) metabolite data. Graphs created using PCA1 and PCA2. Adult GBM samples are depicted in blue and Peds HGG-H3 samples are depicted in red. e and i Volcano plot depicting significance (-log10(p-value) and relative abundance in Adult GBM versus Peds HGG-H3 samples (log2FC) for each polar (e) or lipid (i) metabolite. Dashed lines denote cut-offs for significance (horizontal, FDR < 0.05) and enrichment (vertical, log2FC > 0.5 or < -0.5 for polar metabolites and > 2 or < -2 for lipid metabolites). Metabolites or transcripts with significance and enrichment are in red, significance only in blue, enrichment only in gray, and neither in black. Purple in (i) denotes acylcarnitines. f and g Relative abundance of glucose (f) and lactate (g) in individual Adult GBM (blue) and Peds HGG-H3 (red) samples using the batch corrected data normalized across all samples. h Normalized expression of SLC2A4 (GLUT4) in Adult GBM (blue), Peds HGG-H3 (red), and pilocytic astrocytomas (PA, purple). * denotes, p < 0.05, ** denotes, p < 0.01, and *** denotes p < 0.001. Analysis of metabolite data was done using batch corrected data normalized across only Adult GBM and Peds HGG-H3 samples except in f and g due to inclusion of PA samples
Fig. 5
Fig. 5
A Comparison of Pilocytic Astrocytomas to Pediatric HGG H3 K27M Gliomas Demonstrates Enrichment in Glucose in the H3 Gliomas but No Difference in Acylcarnites. a and b Heatmap reporting the relative abundance of significantly enriched (FDR < 0.05) polar (a) and lipid (b) metabolites in pilocytic astrocytomas (PA) or pediatric high grade glioma H3K27 mutant tumors (Peds H3K27M) after normalization of batch corrected data. Metabolites presented in order of hierarchal clustering results (left). Samples are grouped by subtype (bottom). The scale bar (right) denotes the Z-score relative to the mean for each metabolite. c and d PCA of normalized batch corrected polar (c) and lipid (d) metabolite data. Graphs created using PCA1 and PCA2 (c) or PCA3 (d). PA samples are depicted in blue and Peds H3K27M samples are depicted in red. e and g Volcano plot depicting significance (-log10(p-value) and relative abundance in PA versus Peds H3K27M samples (log2FC) for each polar (e) or lipid (g) metabolite. Dashed lines denote cut-offs for significance (horizontal, FDR < 0.05) and enrichment (vertical, log2FC > 0.5 or < -0.5 for polar metabolites and > 2 or < -2 for lipid metabolites). Metabolites or transcripts with significance and enrichment are in red, significance only in blue, enrichment only in gray, and neither in black. Purple in (g) denotes acylcarnitines. (f) Relative abundance of glucose in individual PA (blue) and Peds H3K27M (red) samples using the normalized batch corrected data. *** denotes p < 0.001. Analysis of metabolite data was done using batch corrected data normalized across only PA and Peds H3K27M samples
Fig. 6
Fig. 6
Model Figure. Adult and pediatric gliomas demonstrate key metabolic differences. Pediatric tumors have enriched glucose levels, possibly from increased levels of GLUT4, an insulin-stimulated glucose transporter. Conversely, adult tumors have a hypoxic tumor microenvironment devoid of glucose. Adult tumors instead have increased levels of acyl carnitines, which support ATP production by the electron transport chain through fatty acid oxidation. Our data propose that adult and pediatric gliomas experience unique microenvironments that necessitate separate metabolic drivers to support malignant proliferation

References

    1. Louis DN, Perry A, Wesseling P et al (2021) The 2021 WHO classification of tumors of the central nervous system: a summary. Neuro Oncol 23(8):1231–1251. 10.1093/neuonc/noab106 - PMC - PubMed
    1. Ostrom QT, Price M, Neff C et al (2022) CBTRUS statistical report: primary brain and other central nervous system tumors diagnosed in the united states in 2015–2019. Neuro-Oncology. 24(Supplement_5):v1–v95. 10.1093/neuonc/noac202 - PMC - PubMed
    1. Wu G, Broniscer A, McEachron TA et al (2012) Somatic histone H3 alterations in pediatric diffuse intrinsic pontine gliomas and non-brainstem glioblastomas. Nat Genet 44(3):251–253. 10.1038/ng.1102 - PMC - PubMed
    1. Schwartzentruber J, Korshunov A, Liu XY et al (2012) Driver mutations in histone H3.3 and chromatin remodelling genes in paediatric glioblastoma. Nature. 482(7384):226–31. 10.1038/nature10833 - PubMed
    1. Kasper LH, Baker SJ (2020) Invited review: emerging functions of histone H3 mutations in paediatric diffuse high-grade gliomas. Neuropathol Appl Neurobiol 46(1):73–85. 10.1111/nan.12591 - PMC - PubMed

Publication types

MeSH terms

LinkOut - more resources