. 2025 Apr;24(4):100945.
doi: 10.1016/j.mcpro.2025.100945. Epub 2025 Mar 13.

Benchmarking of Quantitative Proteomics Workflows for Limited Proteolysis Mass Spectrometry

Affiliations

Benchmarking of Quantitative Proteomics Workflows for Limited Proteolysis Mass Spectrometry

Tomas Koudelka et al. Mol Cell Proteomics. 2025 Apr.

Abstract

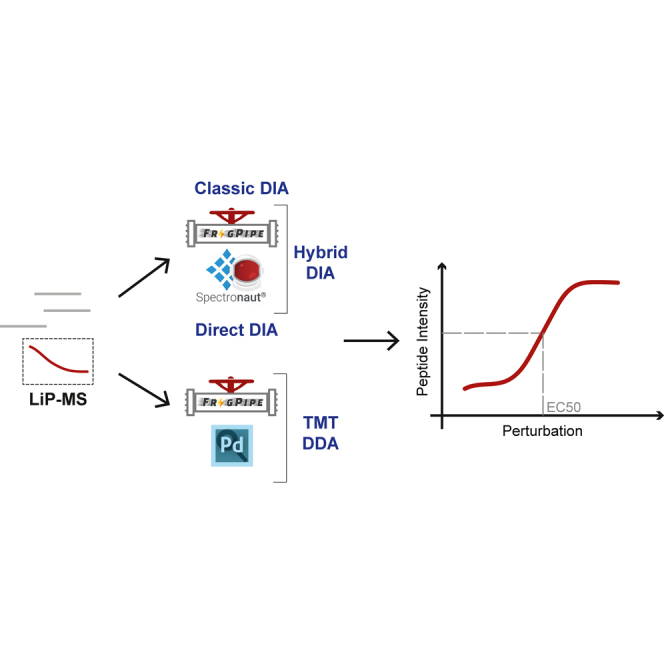
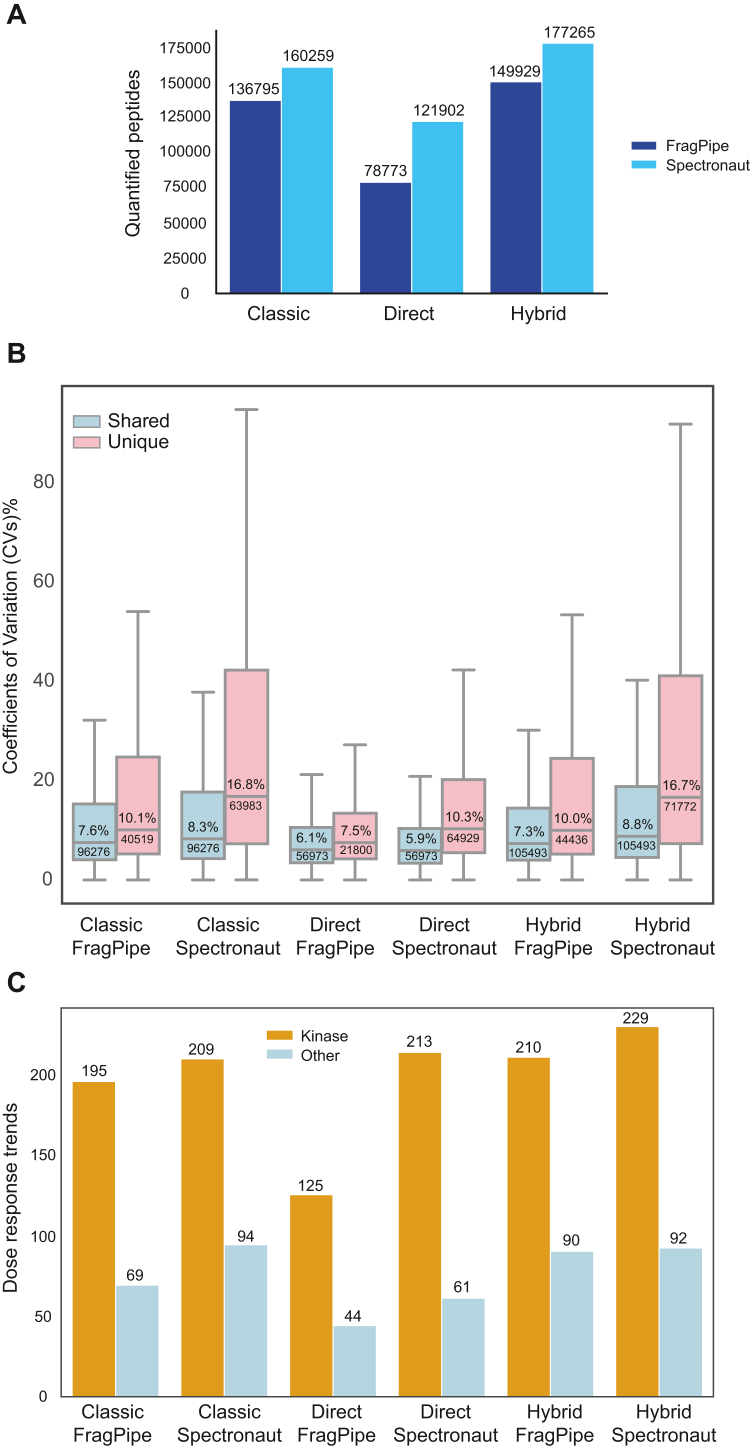
Limited proteolysis coupled with mass spectrometry (LiP-MS) has emerged as a powerful technique for detecting protein structural changes and drug-protein interactions on a proteome-wide scale. However, there is no consensus on the best quantitative proteomics workflow for analyzing LiP-MS data. In this study, we comprehensively benchmarked two major quantification approaches-data-independent acquisition (DIA) and tandem mass tag (TMT) isobaric labeling-in combination with LiP-MS, using a drug-target deconvolution assay as a model system. Our results show that while TMT labeling enabled the quantification of more peptides and proteins with lower coefficients of variation, DIA-MS exhibited greater accuracy in identifying true drug targets and stronger dose-response correlation in peptides of protein targets. Additionally, we evaluated the performance of freely available (FragPipe) versus commercial (Spectronaut) software tools for DIA-MS analysis, revealing that the choice between precision (FragPipe) and sensitivity (Spectronaut) largely depends on the specific experimental context. Our findings underscore the importance of selecting the appropriate LiP-MS quantification strategy based on the study objectives. This work provides valuable guidelines for researchers in structural proteomics and drug discovery, and highlights how advancements in mass spectrometry instrumentation, such as the Astral mass spectrometer, may further improve sensitivity and protein sequence coverage, potentially reducing the need for TMT labeling.

Keywords: DIA software benchmarking; DIA-MS; FAIMS; FragPipe; LiP-MS; TMT; structural proteomics.


Conflict of interest statement

Conflict of interest The authors declare no competing interests.

Figures

None
Graphical abstract
Fig. 1
Fig. 1
Design of the LiP-MS benchmarking experiment and data analysis workflows. A, principle and experimental design of the LiP-MS protein–drug interaction detection experiment. It includes a dose-response analysis approach using the drug staurosporine as a test case. Sample preparation for MS analysis follows a controlled proteolysis reaction with broad specific protease to produce LiP-peptides with abundance proportional to staurosporine dose. B, after mass spectrometry data extraction and quantification, we calculated dose-response curves correlating staurosporine drug concentration and peptide intensities and then rank them by their correlation coefficient r. C, three DIA data acquisition modes (direct-DIA, hybrid-DIA, and classic-DIA) are used for processing with the software tools Spectronaut and FragPipe (with DIA-NN in library free mode). For direct-DIA peptide cleavage products measured for each of the eight staurosporine concentrations in triplicates are measured by DIA-MS and directly processed with label-free quantification (LFQ) with both Spectronaut and FragPipe. In classic-DIA mode DDA-MS data from the same samples are acquired from prefractionated 12 high pH reverse phase (HPRP) fractions to build project specific libraries generated with the database search engines MSFragger-DIA and Pulsar. DIA-MS runs were then searched and quantified by LFQ with both Spectronaut and FragPipe. The hybrid-DIA option combines classic-DIA and direct-DIA. LiP-MS, limited proteolysis coupled with mass spectrometry; DIA, data-independent acquisition; DDA, data-dependent acquisition.
Fig. 2
Fig. 2
LiP-MS peptide quantification quality with multiple DIA-MS modes. A, bar plots of the quantified peptides with the different DIA quantification modes and software. B, box plots of peptide coefficients of variation (% CV). Blue boxes show overlapping peptides shared between the FragPipe and Spectronaut analysis tools. Pink box plots illustrate unique peptides quantified exclusively by each specific tool. The box in each box plot captures the interquartile range with the top and bottom edges representing Q1 and Q3, respectively. The median is the horizontal line within the box. The whiskers lengths extend to the minima or maxima within 1.5 times the interquartile range below Q1 or above Q3. The median value (in % CV) and the number of peptides of the group are reported in inside the box plot. C, bar plots of fitted sigmoidal trends of LiP peptides with r > 0.75 of protein kinases (Kinase) or proteins of other classes (Other). LiP-MS, limited proteolysis coupled with mass spectrometry; DIA, data-independent acquisition; CV, coefficient of variation.
Fig. 3
Fig. 3
Comparing FragPipe and Spectronaut with the LiP-MS hybrid-DIA quantification mode. A, total number of kinase protein targets and common protein kinase targets of staurosporine found using Spectronaut or FragPipe. B, total number of kinase peptide targets and common peptide kinase targets of staurosporine found using Spectronaut or FragPipe. C, box plots of peptide coefficient of variations (% CVs) of different protein categories. Protein kinases (kinase) or proteins of other classes (all proteins) or kinase peptides shared between the FragPipe and Spectronaut analysis tools (shared) or unique kinase peptides quantified exclusively by each specific tool (unique). The box in each box plot captures the interquartile range with the top and bottom edges representing Q1 and Q3, respectively. The median is the horizontal line within the box. The whiskers length extends to the minima or maxima within 1.5 times the interquartile range below Q1 or above Q3. D, receiver operating characteristic (ROC) curves of staurosporine protein interactions, their respective area under the curve (AUC) values, and number of kinase identified (kinases) measured by DIA LiP-MS with a hybrid-DIA library and processed by Spectronaut (cyan) or FragPipe (blue). The dashed line represents a random classifier. The ground truth is represented by the 253 protein kinases quantified with the hybrid-DIA library approach. E, Pearson correlation (r) of the concentrations of drug at which we observed a 50% of the maximum LiP peptide intensities (visualized as −log10 effective concentration or pEC50) extrapolated from the dose-response curves of hybri−d-DIA LiP-MS data quantification with Spectronaut or FragPipe. F, Pearson correlation (r) of the concentrations of drug at which we observed a 50% of the maximum LiP peptide intensities (visualized as −log10 effective concentration or pEC50) from LiP-MS dose-response data (pEC50 Hybrid FragPipe) and pEC50s reported from Kinobeads data (Werner et al. 2012). DIA, data-independent acquisition; LiP-MS, limited proteolysis coupled with mass spectrometry.
Fig. 4
Fig. 4
Performance of TMT and label-free peptide quantification workflows for LiP-MS. A, box plots of protein sequence coverage relative to the following protein groups (from left to right): protein kinases not detected in this experiment, protein kinases quantified in this experiment, and proteins with other functions than kinases. These data are relative to LiP-MS quantified in direct DIA mode using Spectronaut. B, experimental design and principle for data analysis of the TMT-LiP-MS workflow for drug-target deconvolution. C, receiver operating characteristic (ROC) curves of staurosporine protein interactions, their respective area under the curve (AUC) values, and number of kinases identified (Kinases) measured with DIA-MS, a direct library and FragPipe for data extraction (DIA LiP-MS) or measured with TMT-DDA (TMT LiP-MS). The dashed line represents a random classifier. The ground truth is represented by the 185 protein kinases detected by the two quantification methods used here. D, true positive rate evaluation for TMT LiP-MS and DIA LiP-MS on kinase target identification for staurosporine. True positive hits in the top 100 candidates are shown as a function of the number of true and false positives in the candidate list for TMT LiP-MS or DIA LiP-MS. The dashed line indicates a perfect candidate list consisting of only true positives (slope = 1), where true positives are protein kinases, as staurosporine is a promiscuous binder of protein kinases. E, distribution of LiP peptides for DIA LiP-MS (left) and TMT LiP-MS (right) over the r correlation coefficient for kinases (kinase) and non-kinase (other) peptides. The densities of the two populations are normalized by the area under the curve to account for different population sizes, facilitating comparison. The density plots compare kinase and other peptides from the direct DIA experiment analyzed with FragPipe and from the TMT experiment analyzed with Proteome Discoverer, illustrating their distribution based on the correlation coefficient (r). LiP-MS, limited proteolysis coupled with mass spectrometry; DIA, data-independent acquisition; DDA, data-dependent acquisition; TMT, tandem mass tag.

Similar articles

Cited by

References

    1. Feng Y., De Franceschi G., Kahraman A., Soste M., Melnik A., Boersema P.J., et al. Global analysis of protein structural changes in complex proteomes. Nat. Biotechnol. 2014;32:1036–1044. - PubMed
    1. Adhikari J., Fitzgerald M.C. SILAC-pulse proteolysis: a mass spectrometry-based method for discovery and cross-validation in proteome-wide studies of ligand binding. J. Am. Soc. Mass Spectrom. 2014;25:2073–2083. - PubMed
    1. Park C., Marqusee S. Pulse proteolysis: a simple method for quantitative determination of protein stability and ligand binding. Nat. Methods. 2005;2:207–212. - PubMed
    1. Malinovska L., Cappelletti V., Kohler D., Piazza I., Tsai T.H., Pepelnjak M., et al. Proteome-wide structural changes measured with limited proteolysis-mass spectrometry: an advanced protocol for high-throughput applications. Nat. Protoc. 2022 doi: 10.1038/s41596-022-00771-x. - DOI - PubMed
    1. Piazza I., Beaton N., Bruderer R., Knobloch T., Barbisan C., Chandat L., et al. A machine learning-based chemoproteomic approach to identify drug targets and binding sites in complex proteomes. Nat. Commun. 2020;11:4200–4213. - PMC - PubMed

LinkOut - more resources