. 2025 Mar 15;16(1):2557.
doi: 10.1038/s41467-025-57842-2.

Regulation of acetyl-CoA biosynthesis via an intertwined acetyl-CoA synthetase/acetyltransferase complex

Affiliations

Regulation of acetyl-CoA biosynthesis via an intertwined acetyl-CoA synthetase/acetyltransferase complex

Liujuan Zheng et al. Nat Commun. .

Abstract

Acetyl-CoA synthetase (Acs) generates acetyl-coenzyme A (Ac-CoA) but its excessive activity can deplete ATP and lead to a growth arrest. To prevent this, Acs is regulated through Ac-CoA-dependent feedback inhibition executed by Ac-CoA-dependent acetyltransferases such as AcuA in Bacillus subtilis. AcuA acetylates the catalytic lysine of AcsA turning the synthetase inactive. Here, we report that AcuA and AcsA form a tightly intertwined complex - the C-terminal domain binds to acetyltransferase domain of AcuA, while the C-terminus of AcuA occupies the CoA-binding site in the N-terminal domain of AcsA. Formation of the complex reduces AcsA activity in addition to the well-established acetylation of the catalytic lysine 549 in AcsA which we show can disrupt the complex. Thus, different modes of regulation accomplished through AcuA adjust AcsA activity to the concentrations of the different substrates of the reaction. In summary, our study provides detailed mechanistic insights into the regulatory framework underlying acetyl-CoA biosynthesis from acetate.


Conflict of interest statement

Competing interests: The authors declare no competing interests

Figures
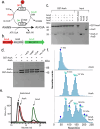
Fig. 1
Fig. 1. Identification of AcuA-AcsA complexes.
a AcsA activity is regulated by AcuA (red) and AcuC (green) through the Ac-CoA dependent acetylation and deacetylation of K549 (bended stick), respectively. This mechanism tightly regulates capacity of AcsA to convert acetate into Ac-CoA, utilizing ATP and acetate as substrates and producing AMP and pyrophosphate as additional products. b Architecture the acuABC operon of B. subtilis encoding proteins AcuA (red), AcuB (gray) and AcuC (green). The gene locus numbers in B. subtilis are also given (compare to: ref. ). c Coomassie-stained SDS-PAGE of a GST-pulldown assay employing GST-AcsA as bait to test interactions with AcuA, AcuB, and AcuC individually as well as in combination. The experiment was repeated three times with similar results. Source data are provided as a Source data file. d Coomassie-stained SDS-PAGE of an in vitro pulldown experiment employing GST-AcuA as bait and AcuA as prey to examine the impact of ATP, AMP, CoA and Ac-CoA on the AcsA-AcuA interaction. The experiment was repeated three times with similar results. Source data are provided as a Source data file. e Chromatograms of analytical size-exclusion chromatography of AcuA (green), AcsA (red) and the AcsA-AcuA complex. f Mass photometry analysis of AcuA (top, 21 kDa), AcsA (middle, monomer 70 kDa, dimer 137 kDa) as well as AcuA-AcsA complexes (bottom, AcsA1-AcuA1, 98 kDa; AcsA2-AcuA1, 166 kDa, and AcsA2-AcuA2,191 kDa).
Fig. 2
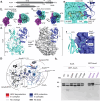
Fig. 2. Structural analysis of the AcsA-AcuA complex.
a Domain topology of AcsA (up) and AcuA (down), drawn to scale. The abbreviations are: NTD: N-terminal domain (orange), CTD: C-terminal domain (red), FL: flexible linker (dotted line), and GNAT/GCN5 protein familiy (blue). b Density map of an AcsA homodimer (PDB number: 9g79), two NTD (cyan and magenta) is shown. c Density map of AcsA2-AcuA1 complex. AcuA (blue) is inserted in AcsA_CTD (cyan) and AcsA_NTD (cyan). d Cartoon and surface representation of the cryo-EM structure of the AcsA-AcuA complex (PDB number: 9g7f). e AcuA_CTD (blue cartoon) inserted into CoA-binding site in AcsA (cyan surface). f Loop including K549 (cyan cartoon) embedded into active sites of AcuA (blue surface). g Changes in HDX occurring in the AcsA-AcuA complex compared to the individual proteins. h Coomassie-stained SDS-PAGE showing the results of pulldown experiments of AcsA_WT with GST-AcuA mutants and of AcsA mutants with GST-AcuA_WT conducted in the absence of Ac-CoA. The experiment was repeated three times with similar results. Source data are provided as a Source data file.
Fig. 3
Fig. 3. AcuA inhibits the activity of AcsA.
a Kinetic analysis of AcsA activity at varying AcuA concentrations. The data was fitted to a Michaelis–Menten curve using GraphPad software, plotted is the mean of three technical replicates. Source data are provided as a Source Data file. b Coomassie-stained SDS-PAGE showing the results a GST-pulldown experiment using GST-AcuA and GST-AcuA_E102Q as bait to assess the interaction with AcsA. Source data are provided as a Source Data file. c The effect of GST-AcuA_E102Q on AcsA activity was compared to the effects of AcuA_WT and AcuA_∆C. The activity assay was also performed without addition AcuA and error bars represent standard deviation of the mean of three independent experiments. Source data are provided as a Source Data file. d Differences in HDX of the AcuA C-terminus (residues 200–210) was analyzed in AcuA-AcsA complexes compared to AcuA alone, across a time range of 10 to 10,000 s. e AcsA activity in the presence of different concentrations (0–1 mM) of the AcuA C-terminus peptide (201-RLRFYHRYMY-210). Plotted are the means of three independent experiments. Error bars represent standard deviation of the mean. Source data are provided as a Source Data file.
Fig. 4
Fig. 4. Ac-CoA and acetate disrupt the AcsA-AcuA complexes at highly different concentration.
The effect of varying Ac-CoA concentrations (top) on the formation of the AcuA-AcsA complexes including AcsA2-AcuA2 (left), AcsA2-AcuA1 (middle), and AcsA1-AcuA1 (right), was determined by mass photometry. The effect of varying acetate concentrations on t AcuA-AcsA complexes in the presence of saturating concentrations of CoA and ATP was also determined as described above. The ratio represents the N counts (peak of interest)/N counts (total) and plotted are the means of three independent experiments. Error bars represent standard deviation of the mean. Source data are provided as a Source Data file.
Fig. 5
Fig. 5. AcuA as a dual inhibitor of AcsA.
a Synthesis of Ac-CoA relies on the rearrangement of the N- and the C-terminal domains of AcsA (NTD in cyan and CTD in red, respectively). Left and middle panels show that adenylate and thioester conformations of AcsA (PDB-IDs: 1T5D and 1PG3, respectively). Right panel: The cryo-EM structure of the AcuA-AcsA complex (this study, PDB-ID: 9G7F) shows that AcuA (blue) “locks” the CTD of AcsA in a position not suitable for catalysis. All structures were superimposed on the NTD of AcsA. b AcuA (blue) can restrict the activity of AcsA in two different ways: firstly, a steric mechanism independent of Ac-CoA and, secondly, an enzymatic mechanism involving the Ac-CoA dependent acetylation of Lys549 (red) (compare left to the right side). c The cryo-EM structure of the AcuA-AcsA complex (this study, PDB-ID: 9G7F) suggests the presence of a channel allowing the direct access of Ac-CoA into the catalytic side of AcuA (shown as sliced surface) for the direct acetylation of Lys549 within the CTD of AcsA.

References

    1. Wolfe, A. J. The acetate switch. Microbiol. Mol. Biol. Rev.69, 12–50 (2005). - PMC - PubMed
    1. Barnhart, E. P. et al. Potential role of acetyl-CoA synthetase (acs) and malate dehydrogenase (mae) in the evolution of the acetate switch in bacteria and archaea. Sci. Rep.5, 12498 (2015). - PMC - PubMed
    1. Starai, V. J. & Escalante-Semerena, J. C. Acetyl-coenzyme A synthetase (AMP forming). Cell. Mol. Life Sci.61, 2020–2030 (2004). - PMC - PubMed
    1. Valgepea, K. et al. Systems biology approach reveals that overflow metabolism of acetate in Escherichia coli is triggered by carbon catabolite repression of acetyl-CoA synthetase. BMC Syst. Biol.4, 1–13 (2010). - PMC - PubMed
    1. Jezewski, A. J. et al. Structural characterization of the reaction and substrate specificity mechanisms of pathogenic fungal acetyl-CoA synthetases. ACS Chem. Biol.16, 1587–1599 (2021). - PMC - PubMed

MeSH terms

LinkOut - more resources