. 2025 May;52(5):2845-2860.
doi: 10.1002/mp.17741. Epub 2025 Mar 16.

Flexible and modular PET: Evaluating the potential of TOF-DOI panel detectors

Affiliations

Flexible and modular PET: Evaluating the potential of TOF-DOI panel detectors

Gašper Razdevšek et al. Med Phys. 2025 May.

Abstract

Background: Panel detectors have the potential to provide a flexible, modular approach to Positron Emission Tomography (PET), enabling customization to meet patient-specific needs and scan objectives. The panel design allows detectors to be positioned close to the patient, aiming to enhance sensitivity and spatial resolution through improved geometric coverage and reduced noncollinearity blurring. Parallax error can be mitigated using depth of interaction (DOI) information.

Purpose: One of the key questions the article addresses is: Do panel detectors offer viable clinical imaging capabilities, or does limited angular sampling restrict their utility by causing image distortions and artifacts? Additionally, this article explores the scalability of panel detectors for constructing scanners with a long axial field of view (LAFOV).

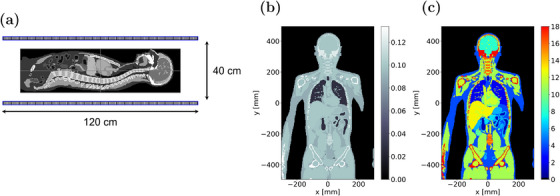
Methods: Monte Carlo simulations using GATE software were used to assess the performance of panel detectors with various DOI resolutions and Time-of-Flight (TOF) resolutions as fine as 70 ps. The 30 × $\times$ 30 cm panels comprised pixelated 3 × $\times$ 3 × $\times$ 20 mm LSO crystals. Simulations were run on large high-performance computing clusters (122,000 CPU cores). Open-source CASToR software was used for (TOF MLEM) image reconstruction. The image quality of the scanners was assessed using a range of phantoms (NEMA, Derenzo, XCAT, and a high-resolution brain phantom). The Siemens Biograph Vision PET/CT scanner served as the reference model. The performance of larger 120 × $\times$ 60 cm panels was also evaluated.

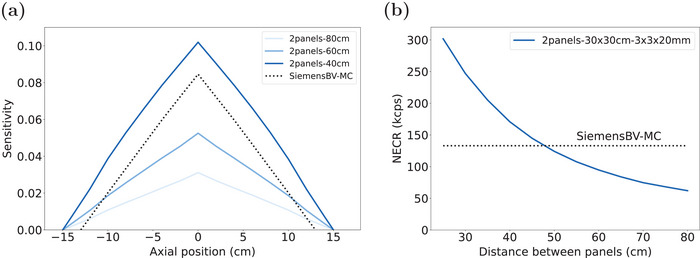
Results: Sensitivity increases over threefold when panel-panel distance is reduced from 80 to 40 cm. The noise equivalent count rate, unmodified by TOF gain, of the panel detectors matches that of the reference clinical scanner at a distance of approximately 50 cm between the panels. Spatial resolution perpendicular to the panels improves from 8.7 to 1.6 mm when the panel-panel distance is reduced, and 70 ps + DOI detectors are used instead of 200 ps, no-DOI detectors. With enhanced TOF and DOI capabilities, panel detectors achieve image quality that matches or surpasses the reference scanner while using about four times less detector material. These detectors can be extended for LAFOV imaging without distortions or artifacts. Additionally, improving TOF and DOI performance enhances contrast-to-noise ratios, thereby improving lesion detection.

Conclusions: A compact 2-panel PET scanner can match the performance of conventional scanners, producing high-quality, distortion-free images. Its mobility and flexibility enable novel applications, including bedside imaging and intensive care unitdiagnostics, as well as imaging in positions such as sitting or standing. Furthermore, the modularity of panel detectors offers the potential to construct cost-effective, high-performance total-body imaging systems.

Keywords: GATE Monte Carlo simulations; depth of interaction (DOI); limited angle pet; panel detectors; time‐of‐flight (TOF).


Conflict of interest statement

The authors declare no conflicts of interest.

Figures

FIGURE 1
FIGURE 1
(a) A schematic view depicting imaging with 2‐panel PET system. While the typical ring diameter of PET scanners is approximately 80 cm, the panel detectors in a flexible system can be brought closer, such as 40 cm, thereby enhancing the sensitivity of the PET system by improving the angular coverage. The figure also shows how the panels are constructed of modules and the size of the LSO crystals. (b) Illustration showing the difference in assumed LOR for a panel detector with and without DOI information. The illustration uses 4‐layer DOI encoding to highlight the reduction in parallax error. DOI, depth of interaction; LOR, line‐of‐response; PET, Positron Emission Tomography.
FIGURE 2
FIGURE 2
(a) Visualization of the GATE simulation using a 1 m long XCAT phantom within a 120 cm long panel system. (b) Attenuation image (cm1) used for computing the attenuation correction factors. (c) The map of 18 different materials defined in the GATE simulation.
FIGURE 3
FIGURE 3
(a) Sensitivity in the axial direction for different panel‐panel distances. The axial sensitivity of the MC simulated Siemens Biograph Vision is added for reference. (b) NECR dependence of the 2‐panel system on the panel‐panel distance at an activity concentration of 5 kBq/mL. MC, Monte Carlo; NECR, noise equivalent count rate.
FIGURE 4
FIGURE 4
(a) Resolution in the y‐direction (the direction orthogonal to the panels) versus MLEM iterations with varying CTR, DOI resolution, and panel distances. (b) Reconstructed point source images for different panel designs, shown at 40 MLEM iterations. The spatial resolution (FWHM) in the x and y directions, along with the distance between panels, is noted at the bottom of each image. CTR, coincidence time resolution; DOI, depth of interaction.
FIGURE 5
FIGURE 5
(a) Transverse views of the reconstructed images of the Derenzo phantom, where different TOF and DOI are considered. The two panels were placed at the top and bottom. (b) A line profile through the reconstructed Derenzo phantom images, going through the 2.5 and 4 mm diameter rods, with a cross‐section of a single voxel, obtained for different detector designs. DOI, depth of interaction; TOF, time‐of‐flight.
FIGURE 6
FIGURE 6
(a) A schematic representation of the NEMA image quality phantom positioned within a 2‐panel PET system, where the panels are set 40 cm apart. (b) Transverse views of the reconstructed images of the NEMA image quality phantom. PET, Positron Emission Tomography.
FIGURE 7
FIGURE 7
Percent contrast versus background variability for a 13 mm and 28 mm diameter hot sphere. Gaussian post‐filters with different widths were used to vary the background variability.
FIGURE 8
FIGURE 8
Transverse, sagittal, and coronal views of the reconstructed brain images. The first column displays the true activity distribution, which was the input into the MC Simulation. The 8‐min simulation yielded 275M true events for the panel scanners and 268M for the SiemensBV. No filtering was applied to the images. MC, Monte Carlo.
FIGURE 9
FIGURE 9
Comparison of the reconstructed images of an XCAT phantom with three hot lesions, each 8 mm in diameter, inserted to evaluate their detectability. The acquisition time for the large panels was 4 min (1.74G true events), while the reference scanner images are shown for both the same acquisition time (0.25G events) and for an equivalent count acquisition (28 min). A 5 mm FWHM Gaussian filter was applied to all images.
FIGURE A1
FIGURE A1
NECR and scatter fraction as a function of the maximum axial difference used to accept coincidences. If no axial filtering is applied, the maximum axial difference corresponds to the full length of the large panel (120 cm). NECR, noise equivalent count rate.
FIGURE B1
FIGURE B1
Reconstructed images using only trues (T), only scatter and randoms (SR), and all coincidences combined (TSR). The T+SR image is obtained by separately reconstructing the T and SR images and then adding them.
FIGURE B2
FIGURE B2
(a) Difference image between TSR and T+SR reconstructions for the 2panels_120x60cm_70ps_DOI design. Note that the color bar scale is 100 times smaller than that in Figure B2, indicating that the maximum voxel‐level differences are on the order of 1%. (b) Profile through the center of the phantom along the longitudinal axis, comparing TSR, T+SR, and the difference image (TSR – T – SR).
FIGURE B3
FIGURE B3
Reconstructed XCAT phantom images with scatter and random corrections applied, corresponding to the images in Figure 9 where only true coincidences were used.
FIGURE B4
FIGURE B4
Profiles through the brain and liver lesions (indicated in the inset image) for reconstructions using only true coincidences, and for those corrected for scatter and random coincidences.

References

    1. MacDonald L, Edwards J, Lewellen T, Haseley D, Rogers J, Kinahan P. Clinical imaging characteristics of the positron emission mammography camera: PEM Flex Solo II. J Nucl Me. 2009;50(10):1666‐1675. doi: 10.2967/jnumed.109.064345 - DOI - PMC - PubMed
    1. Shi Y, Wang Y, Zhou J, et al. DH‐Mammo PET: a dual‐head positron emission mammography system for breast imaging. Phys Med Biol. 2022;67(20):205004. doi: 10.1088/1361-6560/ac934c - DOI - PubMed
    1. Sajedi S, Bläckberg L, Majewski S, Sabet H. Limited‐angle TOF‐PET for intraoperative surgical applications: proof of concept and first experimental data. JINST. 2022;17(01):T01002. doi: 10.1088/1748-0221/17/01/T01002 - DOI
    1. Ferrero V, Fiorina E, Morrocchi M, et al. Online proton therapy monitoring: clinical test of a silicon‐photodetector‐based in‐beam PET. Sci Rep. 2018;8(1):4100. doi: 10.1038/s41598-018-22325-6 - DOI - PMC - PubMed
    1. Gao M, Chen HH, Chen FH, et al. First results from all‐digital PET dual heads for in‐beam beam‐on proton therapy monitoring. IEEE Trans Radiat Plasma Med Sci. 2021;5(6):775‐782. doi: 10.1109/TRPMS.2020.3041857 - DOI

Publication types

LinkOut - more resources