. 2025 Jun 5;145(23):2685-2700.
doi: 10.1182/blood.2024027270.

Single-cell panleukemia signatures of HSPC-like blasts predict drug response and clinical outcome

Affiliations

Single-cell panleukemia signatures of HSPC-like blasts predict drug response and clinical outcome

Changya Chen et al. Blood. .

Abstract

The critical role of leukemia-initiating cells as a therapy-resistant population in myeloid leukemia is well established. However, the molecular signatures of such cells in acute lymphoblastic leukemia remain underexplored. Moreover, their role in therapy response and patient prognosis is yet to be systematically investigated across various types of acute leukemia. We used single-cell multiomics to analyze diagnostic specimens from 96 pediatric patients with acute lymphoblastic, myeloid, and lineage-ambiguous leukemias. Through the integration of single-cell multiomics with extensive bulk RNA sequencing and clinical data sets, we uncovered a prevalent, chemotherapy-resistant subpopulation that resembles hematopoietic stem and progenitor cells (HSPC-like) and is associated with poor clinical outcomes across all subtypes investigated. We identified a core transcriptional regulatory network (TRN) in HSPC-like blasts that is combinatorially controlled by HOXA/AP1/CEBPA. This TRN signature can predict chemotherapy response and long-term clinical outcomes. We identified shared potential therapeutic targets against HSPC-like blasts, including FLT3, BCL2, and the PI3K pathway. Our study provides a framework for linking intratumoral heterogeneity with therapy response, patient outcomes, and the discovery of new therapeutic targets for pediatric acute leukemias.


Conflict of interest statement

Conflict-of-interest disclosure: D.T.T. received research funding from Beam Therapeutics and NeoImmuneTech; serves on advisory boards for Beam Therapeutics, Janssen, Servier, Sobi, and Jazz Pharmaceuticals; and has multiple patents pending on chimeric antigen receptor T-cell therapy. S.P.H. has received consulting fees from Novartis; has received honoraria from Jazz Pharmaceuticals and Servier; and owns common stock in Amgen. The remaining authors declare no competing financial interests.

Figures

None
Graphical abstract
Figure 1.
Figure 1.
The landscape of developmental arrest states across acute leukemia subtypes. (A) Patient cohort across leukemia subtypes. (B-C) Overall UMAPs of all scRNA-seq cells (B) and scATAC-seq cells (C) from 96 leukemia samples, colored by major cell types. (D) Bubble plot of manually curated marker genes for leukemic blasts and healthy cells. Color represents scRNA-seq z score. Bubble size represents the percentage of cells expressing a marker in a given population. (E) UMAPs of healthy human hematopoiesis based on scRNA-seq (left) and scATAC-seq (right) data from healthy donor (HD) samples of pediatric bone marrow and thymus. Cell type annotation for scATAC-seq data was label-transferred from scRNA-seq data. (F) Fractions of leukemic blasts projected onto stem/progenitor, T-lineage, B-lineage, and myeloid-lineage trajectories using healthy reference data. Clinical information of each patient is shown at the bottom. B-M, B-myeloid; CLP, common lymphoid progenitor; DP, double positive T cells; GMP, granulocyte monocyte progenitor; iB-ALL, infant B-ALL; LMPP, lympho-myeloid primed progenitor; MEP, megakaryocyte erythroid progenitor; MPP, multipotent progenitor; pB-ALL, pediatric B-ALL; pDC, plasmacytoid dendritic cells; T-M, T-myeloid; T/NK, T/natural killer cells; UMAP, Uniform Manifold Approximation and Projection.
Figure 2.
Figure 2.
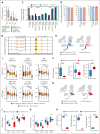
HSPC-like leukemic blasts are commonly observed across high-risk acute leukemias. (A) Fraction of leukemic blasts projected as stem/progenitor-like cells based on scRNA-seq in 4 leukemia subtypes. (B) Genomic tracks of scATAC-seq signal at CD34 (left) and KIT (right) loci in stem/progenitor-like and lineage-like leukemic blasts. Cis-regulatory elements are highlighted in yellow. (C) Fractions of mutant cells detected in HSPC-like, lineage-like blasts, and healthy cells based on 9 recurrent mutations (supplemental Table 4). Mutations in single cells were identified using the Genotyping of Transcriptomes assay. Patient IDs are added in front of the mutation name. (D) Percentage of BM replacement by leukemia blasts in 3 PDX models: T-myeloid MPAL (HSPC-like PDXs n = 4; lineage-like PDXs n = 2; left), ETP-ALL (HSPC-like PDXs n = 2; lineage-like PDXs n = 2; middle), and B-ALL (HSPC-like PDXs n = 8; lineage-like PDXs n = 8; right). Sorted cells (HSPC-like or lineage-like; supplemental Figure 4D-F) were used for the transplant experiments. (E,G) UMAPs show the projections of PDX cells derived from sorted HSPC-like (left) and lineage-like (right) primary leukemic blasts from B-ALL (E) and ETP-ALL (G). Gray dots represent cells from HDs, blue dots cells from HSPC-like derived PDX, and red dots cells from lineage-like derived PDX. (F,H) Fractions of PDX cells projected to particular populations for B-ALL (HSPC-like-derived PDXs n = 8, lineage-like-derived PDXs n = 8) (F) and ETP-ALL (HSPC-like-derived PDXs n = 2; lineage-like-derived PDXs n = 2) (H). Left, HSPC-like; middle, CLP-like; right, lineage-like. P values were computed using the Student t test. (I) Stemness gene signature scores for stem/progenitor-like and lineage-like leukemic blasts in all subtypes. Scores were calculated using AUCell. P values were computed using the Student t test. ∗∗P < .001; ∗∗∗P < .0001. (J-K) Box plots of Shannon entropy scores computed on the basis of scRNA-seq (J) and scATAC-seq (K) projected populations in each patient. Samples with high HSPC-like percentages represented the top 50% of HSPC-like fractions in each disease group, whereas samples with low HSPC-like percentages represented the bottom 50% of HSPC-like fractions in each disease group. P values were computed using the Student t test. ∗P < .05; ∗∗∗∗P < .0001. BM, bone marrow; B-M, B-myeloid; CLP, common lymphoid progenitor; n.s., not significant; T-M, T-myeloid; UMAP, Uniform Manifold Approximation and Projection.
Figure 3.
Figure 3.
HSPC-like leukemic blasts are resistant to chemotherapy in acute leukemias. (A-C) Frequencies of developmental arrest stages of leukemia blasts across leukemia subtypes. Each developmental pseudotime trajectory from HSC/MPP to terminally differentiated population is ordered in 20 bins. Heat maps show the frequencies of each bin from individual patients: AML (n = 10) (A), B-ALL (n = 35) (B), and T-ALL (n = 40) (C). Dashed vertical lines delineate the division between multipotent stem/progenitor-like population and lineage-like populations for each lineage. Bottom line plots show the frequency of each developmental stage along the pseudotime trajectories using HD data: myeloid lineage (A), B-cell lineage (B), and T-cell lineage (C). Legends on the right side show the percentage of MRD for AML and T-ALL or genetic subtypes for B-ALL. (D) Box plots showing the frequencies of HSPC-like blasts in MRD+ vs MRD patients (AML and T-ALL) or in high-risk vs low-risk subtype (B-ALL) patients in the single-cell data of this study. P values were computed using the Student t test. (E) Association between frequency of HSPC-like/lineage-like blasts and EOI MRD values after induction chemotherapy in AML, B-ALL, and T-ALL based on multiple linear regression (supplemental Methods). Error bars show the 95% confidence interval of regression coefficient. The frequencies of HSPC-like and lineage-like blasts were computed using CIBERSORT and bulk RNA-seq data from the National Cancer Institute’s TARGET (AML, B-ALL) project, and the Children’s Oncology Group AALL0434 trial (T-ALL). (F) Association between frequency of HSPC-like/lineage-like blasts and LC50 of 9 conventional chemotherapy drugs. The color of the dots represents regression coefficients and the size of the dots represents the –log10(adjusted P value of regression coefficient). The frequencies of HSPC-like and lineage-like blasts were computed using CIBERSORT. LC50 data and corresponding bulk RNA-seq data sets were downloaded from Lee et al.P values were computed using the Student t test and adjusted for multiple testing using the Benjamini-Hochberg method. Significant associations are indicated with a circle with thicker borders. (G) Drug response curves showing the different response to conventional chemotherapy drugs between HSPC-like derived (n = 2) and lineage-like derived PDX cells (n = 2). (H) Frequencies of HSPC-like blasts from PDX treatment groups based on PDX treatment scRNA-seq data. Sample numbers: dexamethasone (Dex) n = 5; vincristine (VCR) n = 2; untreated controls n = 7. P values were computed using the Student t test. (I) Volcano plot showing the DEGs comparing dexamethasone-treated PDXs and control PDXs based on scRNA-seq data. Red dots represent the genes with adjusted P value <.05 and abs(log2FC) > 0.25; purple dots represent the genes with adjusted P value < .05 only; black dots represent the nonsignificant genes. CLP, common lymphoid progenitor; Ctrl, control; DP, double positive T cells; GMP, granulocyte monocyte progenitor; LC50, lethal concentration 50%; LMPP, lympho-myeloid primed progenitor; MPP, multipotent progenitor; NK, natural killer; TNF, tumor necrosis factor.
Figure 4.
Figure 4.
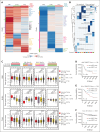
HSPC-like blast transcriptomic signatures predict clinical outcome. (A) Heat maps of DEGs between HSPC-like and lineage-like blasts across leukemia subtypes: upregulated genes in HSPC-like blasts in at least 1 subtype (left); downregulated genes in HSPC-like blasts in at least 1 subtype (right). DEGs were determined by abs(log2[FC]) > 0.25 and adjusted P value < .05. DEGs were pooled and clustered by k-means clustering (k = 9 for left panel, k = 5 for right panel) on the basis of their log2FC. The full list of DEGs is provided in supplemental Table 5. (B) Heat map showing enriched gene ontology terms of each DEG cluster in panel A. Shades of blue represent the –log10(enrichment P value). Selected terms are labeled. (C) Single-cell RNA-seq–derived HSPC-like signatures can stratify MRD levels in bulk RNA-seq cohort. Rows, leukemia subtypes; columns, single-cell derived signatures. The AML cohort was divided into induction failure (MRD > 5%), MRD5 (5% ≥ MRD > 1%), MRD1 (1% ≥ MRD > 0.1%), and MRD⁻ (MRD ≤ 0.1%); B-ALL and T-ALL cohorts were divided into induction failure (MRD > 5%), MRD5 (5% ≥ MRD > 1%), MRD1 (1% ≥ MRD > 0.01%), and MRD- (MRD ≤ 0.01%) on the basis of their day 29 MRD level at the EOI. Dashed boxes highlight the comparison that related to each signature. Sample numbers for each group were indicated. P values were computed using the 2-sided Student t test. The source of AML and B-ALL cohorts: TARGET; T-ALL cohort: AALL0434. (D-F) Pan-HSPC-like signature can stratify patient survival across leukemia subtypes. The source of patient cohort data and case numbers are indicated at the top of each plot. The P values were calculated using the log-likelihood statistic from the Cox proportional hazards test with central nervous system status and white blood cell count included as covariates. BCR, B-cell receptor; OS, overall survival; TCR, T-cell receptor.
Figure 5.
Figure 5.
Core transcriptional regulatory circuitries of HSPC-like blasts. (A) Heat map showing enriched gene ontology terms of each regulon in the shared TRN (see “Methods”). Shades of blue represent –log10(enrichment P value). Selected terms are labeled. (B) Bar plots showing the numbers of shared and leukemia subtype–specific targets of each core TF. (C) Box plots showing log2 expression fold-change of shared and subtype-specific targets. Red dashed lines indicate log2FC = 0. (D) Core HSPC-like TRN shared across leukemia subtypes. All TFs and targets are shared across leukemia subtypes. Node color represents average log2FC between HSPC-like and lineage-like blasts across leukemia subtypes. (E) Enriched gene ontology terms of shared targets. (F) Core TRN signature in baseline and in silico TF KO matrices in AML HSPC-like blasts using scRNA-seq in this study (B-ALL results in supplemental Figure 9C; T-ALL results in supplemental Figure 9D). The colored boxes represent baseline signatures; gray boxes represent in silico TF KO signatures. P values were computed using the Student t test. (G) Core TRN signature in paired pediatric T-ALL bulk RNA-seq data set from X01.P values were computed using a paired t test. (H) Core TRN signature for the PDX treatment scRNA-seq data set in this study. P values were computed using the 2-sided Student t test. (I) Core TRN signature stratifies MRD level in the bulk RNA-seq cohort. Each cohort was classified as induction failure (≥5%), MRD5 (≥1% and <5%), MRD1 (≥0.01%), and MRD⁻ on the basis of day 29 MRD level at the EOI. The source of AML and B-ALL cohorts: TARGET; the source of 2 T-ALL cohorts: X01 and TARGET. P values were computed using the Student t test and indicated on the top of each box plot. Red dashed lines indicate a TRN score of 0 on the y-axis. (J) TRN signature stratifies patient survival across leukemia subtypes. The source of patient cohort data is indicated at the top of each plot. The P values were calculated using the log-likelihood statistic from the Cox proportional hazards test with central nervous system status and white blood cell count as covariates. Dex, dexamethasone; IF, induction failure; KO, knockout; OS, overall survival; TNF, tumor necrosis factor; TRN, transcriptional regulatory network; Vinc, vincristine.
Figure 5.
Figure 5.
Core transcriptional regulatory circuitries of HSPC-like blasts. (A) Heat map showing enriched gene ontology terms of each regulon in the shared TRN (see “Methods”). Shades of blue represent –log10(enrichment P value). Selected terms are labeled. (B) Bar plots showing the numbers of shared and leukemia subtype–specific targets of each core TF. (C) Box plots showing log2 expression fold-change of shared and subtype-specific targets. Red dashed lines indicate log2FC = 0. (D) Core HSPC-like TRN shared across leukemia subtypes. All TFs and targets are shared across leukemia subtypes. Node color represents average log2FC between HSPC-like and lineage-like blasts across leukemia subtypes. (E) Enriched gene ontology terms of shared targets. (F) Core TRN signature in baseline and in silico TF KO matrices in AML HSPC-like blasts using scRNA-seq in this study (B-ALL results in supplemental Figure 9C; T-ALL results in supplemental Figure 9D). The colored boxes represent baseline signatures; gray boxes represent in silico TF KO signatures. P values were computed using the Student t test. (G) Core TRN signature in paired pediatric T-ALL bulk RNA-seq data set from X01.P values were computed using a paired t test. (H) Core TRN signature for the PDX treatment scRNA-seq data set in this study. P values were computed using the 2-sided Student t test. (I) Core TRN signature stratifies MRD level in the bulk RNA-seq cohort. Each cohort was classified as induction failure (≥5%), MRD5 (≥1% and <5%), MRD1 (≥0.01%), and MRD⁻ on the basis of day 29 MRD level at the EOI. The source of AML and B-ALL cohorts: TARGET; the source of 2 T-ALL cohorts: X01 and TARGET. P values were computed using the Student t test and indicated on the top of each box plot. Red dashed lines indicate a TRN score of 0 on the y-axis. (J) TRN signature stratifies patient survival across leukemia subtypes. The source of patient cohort data is indicated at the top of each plot. The P values were calculated using the log-likelihood statistic from the Cox proportional hazards test with central nervous system status and white blood cell count as covariates. Dex, dexamethasone; IF, induction failure; KO, knockout; OS, overall survival; TNF, tumor necrosis factor; TRN, transcriptional regulatory network; Vinc, vincristine.
Figure 6.
Figure 6.
Identification of drug targets against HSPC-like blasts. (A) Schema for in silico drug screening. DEG 1: DEGs from comparison between HSPC-like and lineage-like blasts; DEG 2: DEGs from comparison between HSPC-like blasts and normal HSPCs. (B-D) Scatterplots showing the log2FC of DEGs based on scRNA-seq data in this study for AML (B), B-ALL (C), and T-ALL (D). (E) Overall scores of top 30 genes with known drugs based on the in silico screening. The type of supporting evidence is color-coded. (F) DepMap essentiality scores for BCL2, FLT3, and PIK3R1 in leukemia cell lines and nonleukemia cell lines, respectively. P values were computed using the Student t test. (G) Dot plot of association between subpopulation frequencies and IC50 values. The color of the dots represents regression coefficients and the size of the dots represents the –log10(adjusted P value of regression coefficient). The frequencies of HSPC-like and lineage-like blasts were computed using CIBERSORT. LC50 data and corresponding bulk RNA-seq data sets were downloaded from Lee et al.P values were computed using the Student t test and adjusted for multiple testing using the Benjamini-Hochberg method. Significant associations are highlighted with circles with thicker borders. (H) Drug response curves showing the different response to FLT3i (sorafenib) and PI3Ki (buparlisib) between HSPC-like derived (n = 2) and lineage-like-derived (n = 2) PDX cells. DE, differentially expressed genes; IC50, 50% inhibitory concentration;LC50, lethal concentration 50%; n.s., not significant; TTD, Therapeutic Target Database. The logos at the bottom of panel A are reused under Creative Commons licenses.

Comment in

References

    1. Dick JE. Acute myeloid leukemia stem cells. Ann N Y Acad Sci. 2005;1044(1):1–5. - PubMed
    1. Lapidot T, Sirard C, Vormoor J, et al. A cell initiating human acute myeloid leukaemia after transplantation into SCID mice. Nature. 1994;367(6464):645–648. - PubMed
    1. Bonnet D, Dick JE. Human acute myeloid leukemia is organized as a hierarchy that originates from a primitive hematopoietic cell. Nat Med. 1997;3(7):730–737. - PubMed
    1. Cobaleda C, Gutiérrez-Cianca N, Pérez-Losada J, et al. A primitive hematopoietic cell is the target for the leukemic transformation in human Philadelphia-positive acute lymphoblastic leukemia. Blood. 2000;95(3):1007–1013. - PubMed
    1. le Viseur C, Hotfilder M, Bomken S, et al. In childhood acute lymphoblastic leukemia, blasts at different stages of immunophenotypic maturation have stem cell properties. Cancer Cell. 2008;14(1):47–58. - PMC - PubMed