. 2025 Jul 10;146(2):191-205.
doi: 10.1182/blood.2024026664.

Blunted CD40-responsive enhancer activation in CREBBP-mutant lymphomas can be restored by enforced CD4 T-cell engagement

Affiliations

Blunted CD40-responsive enhancer activation in CREBBP-mutant lymphomas can be restored by enforced CD4 T-cell engagement

Haopeng Yang et al. Blood. .

Abstract

The CREBBP lysine acetyltransferase (KAT) is frequently mutated in follicular lymphoma and diffuse large B-cell lymphoma and has been studied using gene knockout in murine and human cells. However, most CREBBP mutations encode amino acid substitutions within the catalytic KAT domain (CREBBP KAT-PM) that retain an inactive protein and have not been extensively characterized. Using CRISPR gene editing and extensive epigenomic characterization of lymphoma cell lines, we found that CREBBP KAT-PM lead to unloading of CREBBP from chromatin, loss of enhancer acetylation, and prevention of EP300 compensation. These enhancers were enriched for those that are dynamically loaded by CREBBP in the normal centroblast-to-centrocyte transition in the germinal center, including enhancers activated in response to CD40 signaling, leading to blunted molecular response to CD40 ligand in lymphoma cells. We provide evidence that CREBBP KAT-PM inhibits EP300 function by binding limiting quantities nuclear transcription factor (TF), thereby preventing its compensatory activity. This effect can be experimentally overcome by expressing saturating quantities of TF or biologically attenuated by strong stimulation of CD40 signaling that increases nuclear TF abundance. Importantly, epigenetic responses to CD40 signaling can be induced by enforcing CD4 T-cell engagement using a bispecific antibody, leading to CD40-dependent restoration of antigen presentation machinery in CREBBP KAT-PM cells and cell death. Therefore, we provide a mechanistic basis for enhancer deregulation by CREBBP KAT-PM and highlight enforced CD4 T-cell engagement as a potential approach for overcoming these effects.


Conflict of interest statement

Conflict-of-interest disclosure: M.R.G. reports research funding from Sanofi (including this study), Kite/Gilead, AbbVie, and Allogene; consulting for AbbVie, Allogene, and Bristol Myers Squibb; honoraria from Daiichi Sankyo and DAVA Oncology; and stock ownership of KDAc Therapeutics. S.N. received research support from Kite/Gilead, Bristol Myers Squibb, Cellectis, Poseida, Allogene, Unum Therapeutics, Precision Biosciences, and Adicet Bio; served as advisory board member/consultant for Kite/Gilead, Merck, Novartis, SELLAS Life Sciences, Athenex, Allogene, Incyte, Adicet Bio, Bristol Myers Squibb, Legend Biotech, bluebird bio, Fosun Kite, Sana Biotechnology, Caribou, Astellas Pharma, MorphoSys, Janssen, Chimagen, ImmunoACT, and Orna Therapeutics; has received royalty income from Takeda Pharmaceuticals; has stock options from Longbow Immunotherapy, Inc; and has intellectual property related to cell therapy. L.N. reports honoraria for participation on advisory boards from ADC Therapeutics, Atara, Bristol Myers Squibb, Caribou Biosciences, Epizyme, Genentech, Genmab, Gilead/Kite, Janssen, MorphoSys, Novartis, and Takeda; reports research support from Bristol Myers Squibb, Caribou Biosciences, Epizyme, Genentech, Genmab, Gilead/Kite, Janssen, IGM Biosciences, Novartis, and Takeda; and serves on a data safety and monitoring board for Denovo, Genentech, MEI Pharma, and Takeda. C.R.F. reports consulting for AbbVie, Bayer, BeiGene, Celgene, Denovo Biopharma, Foresight Diagnostics, Genentech/Roche, Genmab, Gilead, Karyopharm, N-Power Medicine, Pharmacyclics/Janssen, Seagen, and Spectrum; research funding from 4D, AbbVie, Acerta, Adaptimmune, Allogene, Amgen, Bayer, Celgene, Cellectis EMD, Gilead, Genentech/Roche, Guardant, Iovance, Janssen Pharmaceuticals, Kite, MorphoSys, Nektar, Novartis, Pfizer, Pharmacyclics, Sanofi, Takeda, TG Therapeutics, Xencor, Ziopharm, Burroughs Wellcome Fund, Eastern Cooperative Oncology Group, National Cancer Institute, V Foundation, and Cancer Prevention and Research Institute of Texas; and stock options in Foresight Diagnostics and N-Power Medicine. The remaining authors declare no competing financial interests.

Figures

None
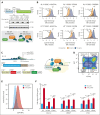
Graphical abstract
Figure 1.
Figure 1.
Differential spectrum and effect of CREBBP mutations in human lymphoma. (A) Lollipop plots of the mutation spectrum of CREBBP from 1028 FL (left) and 3103 DLBCL (right) tumors. (B) The frequency of CREBBP hot spot mutations and nonsense/frameshift (truncating) mutations in FL (n = 1028), transformed FL (tFL) (n = 188), and DLBCL (n = 3103). (C) Western blot analysis of CREBBP and EP300 protein expression in CRISPR edited RL (left) and HT (right) lymphoma cell lines. (D-E) Unsupervised principal component analysis (PCA) of RNA-seq (D) and H3K27Ac CUT&RUN (E) data from CRISPR edited RL and HT lymphoma cell lines.
Figure 2.
Figure 2.
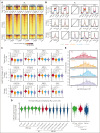
Loss of enhancer and promoter activity in CREBBP KAT-PM cells. (A) Heat maps of regions with significant H3K27Ac loss in RL cells with CREBBP KAT-PM (R1446C, Y1482N, Y1503C) compared with WT (FDR <0.05), also showing H3K27Ac abundance in CREBBP KO cells. (B-C) Density plots (B) and violin plots (C) of relative change compared with WT for histone posttranslational modifications and chromatin accessibility in RL cells with CREBBP KO different KAT-PMs (R1446C, Y1482N, Y1503C), showing regions from panel A. (D) Relative abundance of H3K27Ac in primary FL tumor cells, normalized to the average of CREBBP WT tumors, showing regions of consensus H3K27Ac loss in CRISPR edited CREBBP KAT-PM RL and HT cells compared with isogenic WT controls. (E) Density plot of relative H3K27me3 in RL CREBBP KAT-PM (R1446C, Y1482N, Y1503C) or KO CRISPR edited cells compared with isogenic WT controls, showing regions from panel A.
Figure 3.
Figure 3.
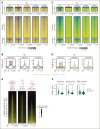
Loss of CREBBP loading and EP300 compensation over regions of reduced H3K27Ac in CREBBP KAT-PM cells. (A-B) Heat maps (A) and density plots (B) of EP300 CUT&RUN in isogenic RL cells with CREBBP WT, KO, and different KAT-PMs (R1446C, Y1482N, Y1503C), showing regions from Figure 2A. (C-D) Heat maps (C) and density plots (D) of CREBBP CUT&RUN in isogenic RL cells with CREBBP WT, KO, and different KAT-PMs (R1446C, Y1482N, Y1503C), showing regions from Figure 2A. (E) Heat maps of the relative density of CREBBP loading in KAT-PM compared with WT CRISPR edited RL cells (left), primary FL tumors (middle), and DLBCL PDX models (right), showing all consensus CREBBP peaks in RL and HT cells. (F) Violin plots showing the RPKM of CREBBP CUT&RUN for WT and KAT-PM isogenic cell lines (left), primary FL biopsies (middle), and PDX models (right). P values were calculated with a Wilcoxon rank-sum test. Super-enh, super-enhancer.
Figure 4.
Figure 4.
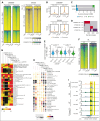
Dynamic loading of CREBBP and EP300 during the CB-to-CC cell state transition. (A-B) Heat maps (A) and density plots (B) of regions with significantly (FDR <0.05) different loading of CREBBP (left) and EP300 (right) between CBs and CCs. (C) Number of peaks with dynamic loading (green) or unloading (blue) of CREBBP or EP300 in the CB-to-CC transition. (D) Overlap of regions with differential loading of CREBBP or EP300 in CBs and CCs. (E) Quantification of the change in CREBBP loading between KAT-PM (R1446C, Y1482N, Y1503C) and WT cells over regions with dynamic loading of CREBBP or EP300 in the CB-to-CC transition (regions from panel C). (F) Heat map of CREBBP loading in isogenic WT and CREBBP KAT-PM (average of R1446C, Y1482N, Y1503C) cells over regions with significantly increased CREBBP loading in CC compared with CB. ∗∗∗P < 2.2 × 10⁻¹⁶. (G) Hypergeometric gene set enrichment analysis (hGSEA) of genes associated with peaks with or without differential loading of CREBBP or EP300 in the CB-to-CC transition (corresponding to panel C) or with significant loss of CREBBP loading in KAT-PM cells compared with isogenic WT controls. (H) TF motif enrichment analysis (HOMER) of peaks with or without differential loading of CREBBP or EP300 in the CB-to-CC transition (corresponding to panel C). (I) Tracks showing the CD74 locus as a representative example of regions with significant (FDR < 0.05; highlighted in yellow) gain in CREBBP loading in the CB-to-CC transition and loss of CREBBP loading in KAT-PM cells compared with isogenic WT controls in both CRISPR engineered cell lines (RL and HT) and primary FL tumor cells. Tracks represent overlays of biological replicates.
Figure 5.
Figure 5.
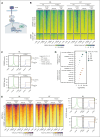
Blunted CD40 response in CREBBP KAT domain point mutants. (A) Schematic of CD40 signaling in B cells. (B-C) Heat maps (B) and density plots (C) of significant changes in CREBBP loading (FDR < 0.05) after CD40L + IL-4 treatment in isogenic CREBBP WT cells, showing analogous changes in CREBBP Y1503C mutant cells. ∗∗∗Wilcoxon rank-sum P < 2.2 × 10⁻¹⁶. (D) Bubble plots of gene set enrichment analysis for regions with increased H3K27Ac (above) or CREBBP loading (below) after CD40L + IL-4 stimulation. (E-F) Heat maps and density plots of H3K27Ac gain (E) and EP300 loading (F) over regions with significantly increased CREBBP loading in CREBBP WT cells after CD40L + IL-4 treatment (regions from panel B). ∗∗∗Wilcoxon rank-sum P < 2.2 × 10⁻¹⁶. (G) RNA-seq gene set variation analysis (GSVA) scores for CD40-responsive gene sets in isogenic CREBBP WT and Y1503C RL cells with or without CD40L + IL-4 stimulation. (H) Western blot of nuclear and cytoplasmic fractions for NF-κB (p50/p105; p65) and IRF4 TFs after CD40L + IL-4 treatment. (I) Fold enrichment of TF motifs within regions of H3K27Ac gain, comparing CREBBP WT (y-axis) and Y1503C (x-axis) cells. (J) NF-κB reporter assay in CREBBP WT (green) and Y1503C (purple) cells with a dose titration of CD40L. Adjusted Student t test ∗∗P < .01; ∗∗∗P < .001.
Figure 5.
Figure 5.
Blunted CD40 response in CREBBP KAT domain point mutants. (A) Schematic of CD40 signaling in B cells. (B-C) Heat maps (B) and density plots (C) of significant changes in CREBBP loading (FDR < 0.05) after CD40L + IL-4 treatment in isogenic CREBBP WT cells, showing analogous changes in CREBBP Y1503C mutant cells. ∗∗∗Wilcoxon rank-sum P < 2.2 × 10⁻¹⁶. (D) Bubble plots of gene set enrichment analysis for regions with increased H3K27Ac (above) or CREBBP loading (below) after CD40L + IL-4 stimulation. (E-F) Heat maps and density plots of H3K27Ac gain (E) and EP300 loading (F) over regions with significantly increased CREBBP loading in CREBBP WT cells after CD40L + IL-4 treatment (regions from panel B). ∗∗∗Wilcoxon rank-sum P < 2.2 × 10⁻¹⁶. (G) RNA-seq gene set variation analysis (GSVA) scores for CD40-responsive gene sets in isogenic CREBBP WT and Y1503C RL cells with or without CD40L + IL-4 stimulation. (H) Western blot of nuclear and cytoplasmic fractions for NF-κB (p50/p105; p65) and IRF4 TFs after CD40L + IL-4 treatment. (I) Fold enrichment of TF motifs within regions of H3K27Ac gain, comparing CREBBP WT (y-axis) and Y1503C (x-axis) cells. (J) NF-κB reporter assay in CREBBP WT (green) and Y1503C (purple) cells with a dose titration of CD40L. Adjusted Student t test ∗∗P < .01; ∗∗∗P < .001.
Figure 6.
Figure 6.
Rescue of CREBBP and EP300 loading by saturating TF and local histone acetylation. (A) Western blot and schematic showing tetracycline-inducible IRF4 expression. (B) Density plots of H3K27Ac (left), EP300 (middle), and CREBBP (right) in RL (above) and HT (below) CREBBP Y1503C cells, relative to isogenic WT controls, showing regions that are predicted to be bound by IRF4. (C) Schematic showing the placement of dual-guide RNAs over the CD74 enhancer with reduced H3K27Ac in CREBBP KAT-PM cells compared with isogenic WT controls. (D) Representative flow cytometry plot showing fluorescent markers of each guide-RNA construct, enabling comparison of dual-positive and dual-negative populations. (E) Flow cytometry of CD74 expression in cells with no guide RNA (blue) or 2 guide RNAs (dual guides, red) for the dCas9-p300 system. (F) Fold change in the abundance of H3K27Ac, EP300, and CREBBP on the CD74 enhancer in no guide (blue) and dual-guide (red) populations, normalized to the no guide condition in WT cells.
Figure 7.
Figure 7.
Induction of CD40 signaling and cell death by CD4 T-cell engagement with mosunetuzumab. (A) Schematic of the rationale for using mosunetuzumab to engage CD40 signaling in lymphoma B cells. (B) GSEA normalized enrichment scores (NES) of signatures induced by CD40L + IL-4, comparing CD4 T-cell engagement with mosunetuzumab (mosun). (C) Heat maps showing regions of significantly (FDR <0.05) increased CREBBP (left), EP300 (middle), and H3K27Ac (right) at 12 and 24 hours after CD4 T-cell engagement with mosunetuzumab compared with control. (D) Altuna plot of the overlap of regions shown in panel C. (E) Heat map of hGSEA FDR q-values for genes with increased H3K27Ac, CREBBP, or EP300 at 12 and 24 hours after CD4 T-cell engagement with mosunetuzumab compared with control. (F) Bubble plot of motif enrichment analysis (HOMER) for increased H3K27Ac at 12 and 24 hours after CD4 T-cell engagement with mosunetuzumab compared with control. (G) Cell viability of CREBBP R1446C or Y1503C mutant RL cells with (red) or without (blue) CD40 KO at different effector-to-target ratios of CD4 T cells to lymphoma cells with 100 ng/mL of mosunetuzumab. Student t test ∗P < .05; ∗∗P < .01; ∗∗∗P < .001. (H) CD4 T-cell killing of CREBBP Y1503C mutant RL cells within mixed cultures of CD40-positive and CD40-negative cells. (I) Comparison of the relative fraction of CD40 WT and CD40 KO cells within mixed cultures at the start (day 0) and end (day 2) of cocultures with CD4 T cells plus mosunetuzumab.
Figure 7.
Figure 7.
Induction of CD40 signaling and cell death by CD4 T-cell engagement with mosunetuzumab. (A) Schematic of the rationale for using mosunetuzumab to engage CD40 signaling in lymphoma B cells. (B) GSEA normalized enrichment scores (NES) of signatures induced by CD40L + IL-4, comparing CD4 T-cell engagement with mosunetuzumab (mosun). (C) Heat maps showing regions of significantly (FDR <0.05) increased CREBBP (left), EP300 (middle), and H3K27Ac (right) at 12 and 24 hours after CD4 T-cell engagement with mosunetuzumab compared with control. (D) Altuna plot of the overlap of regions shown in panel C. (E) Heat map of hGSEA FDR q-values for genes with increased H3K27Ac, CREBBP, or EP300 at 12 and 24 hours after CD4 T-cell engagement with mosunetuzumab compared with control. (F) Bubble plot of motif enrichment analysis (HOMER) for increased H3K27Ac at 12 and 24 hours after CD4 T-cell engagement with mosunetuzumab compared with control. (G) Cell viability of CREBBP R1446C or Y1503C mutant RL cells with (red) or without (blue) CD40 KO at different effector-to-target ratios of CD4 T cells to lymphoma cells with 100 ng/mL of mosunetuzumab. Student t test ∗P < .05; ∗∗P < .01; ∗∗∗P < .001. (H) CD4 T-cell killing of CREBBP Y1503C mutant RL cells within mixed cultures of CD40-positive and CD40-negative cells. (I) Comparison of the relative fraction of CD40 WT and CD40 KO cells within mixed cultures at the start (day 0) and end (day 2) of cocultures with CD4 T cells plus mosunetuzumab.

Comment in

  • Beware the zombie enzyme.
    Dominguez-Sola D. Dominguez-Sola D. Blood. 2025 Jul 10;146(2):135-136. doi: 10.1182/blood.2025028953. Blood. 2025. PMID: 40638202 No abstract available.

References

    1. Green MR. Chromatin modifying gene mutations in follicular lymphoma. Blood. 2018;131(6):595–604. - PMC - PubMed
    1. Pasqualucci L, Dominguez-Sola D, Chiarenza A, et al. Inactivating mutations of acetyltransferase genes in B-cell lymphoma. Nature. 2011;471(7337):189–195. - PMC - PubMed
    1. Mullighan CG, Zhang J, Kasper LH, et al. CREBBP mutations in relapsed acute lymphoblastic leukaemia. Nature. 2011;471(7337):235–239. - PMC - PubMed
    1. Meyer SN, Scuoppo C, Vlasevska S, et al. (2019). Unique and shared epigenetic programs of the CREBBP and EP300 acetyltransferases in germinal center B cells reveal targetable dependencies in lymphoma. Immunity. 2019;51(3):535–547.e9. - PMC - PubMed
    1. Mondello P, Tadros S, Teater M, et al. Selective inhibition of HDAC3 targets synthetic vulnerabilities and activates immune surveillance in lymphoma. Cancer Discov. 2020;10(3):440–459. - PMC - PubMed

MeSH terms