. 2025 Mar 17;32(1):36.
doi: 10.1186/s12929-025-01129-7.

Metformin sensitizes triple-negative breast cancer to histone deacetylase inhibitors by targeting FGFR4

Affiliations

Metformin sensitizes triple-negative breast cancer to histone deacetylase inhibitors by targeting FGFR4

Zhangyuan Gu et al. J Biomed Sci. .

Abstract

Background: Triple-negative breast cancer (TNBC) is characterized by high malignancy, strong invasiveness, and a propensity for distant metastasis, leading to poor prognosis and relatively limited treatment options. Metformin, as a first-line oral hypoglycemic agent, has garnered widespread research interest in recent years due to its potential in cancer prevention and treatment. However, its efficacy varies significantly across different tumor types. Histone deacetylase inhibitors (HDACi), such as SAHA, have demonstrated antitumor activity, but TNBC responds poorly to HDACi monotherapy, possibly due to feedback activation of the JAK-STAT pathway. Exploring the synergistic potential and underlying mechanisms of combining metformin with HDACi in TNBC treatment is crucial.

Methods: We predicted the synergistic effects of metformin and SAHA in TNBC using multiple computational methods (CMap, DTsyn, and DrugComb). We also developed a cancer-specific compound mimic library (CDTSL) and applied a three-step strategy to identify genes fitting the "metformin sensitization" model. Subsequently, we evaluated the synergistic effects of metformin and SAHA in TNBC cell lines through cell proliferation, colony formation, and apoptosis assays. Furthermore, we investigated the molecular mechanisms of the combined treatment using techniques such as transcriptome sequencing, chromatin immunoprecipitation (ChIP), Western blotting, and measurement of extracellular acidification rate (ECAR). Additionally, we assessed the in vivo antitumor effects of the combined therapy in a nude mouse subcutaneous xenograft model.

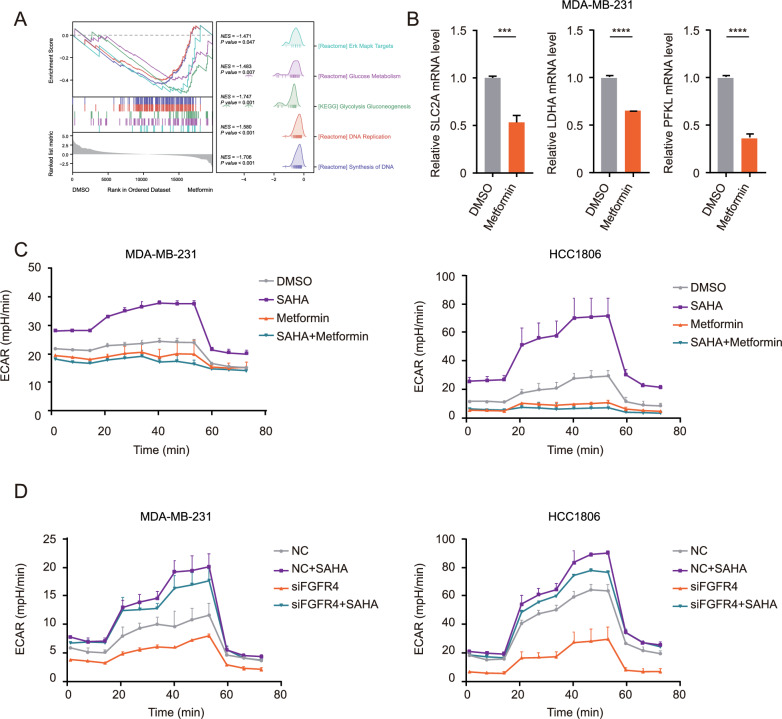
Results: CMap, DTsyn, and DrugComb all predicted the synergistic effects of SAHA and metformin in TNBC. The screening results revealed that HDAC10 played a key role in metformin sensitization. We found that the combination of metformin and SAHA exhibited synergistic antitumor effects (combination index CI < 0.9) in TNBC cell lines. Mechanistically, metformin inhibited histone acetylation on FGFR4, thereby blocking the feedback activation of FGFR4 downstream pathways induced by SAHA. Furthermore, metformin interfered with the glycolysis process induced by SAHA, altering the metabolic reprogramming of tumor cells. In in vivo experiments, the combined treatment of metformin and SAHA significantly inhibited the growth of subcutaneous tumors in nude mice.

Conclusions: Metformin enhances the sensitivity of TNBC to HDAC inhibitors by blocking the FGFR4 pathway and interfering with metabolic reprogramming. When used in combination with SAHA, metformin exhibits synergistic antitumor effects. Our study provides a theoretical basis for the combined application of HDAC inhibitors and metformin, potentially offering a new strategy for the treatment of TNBC.

Keywords: Drug synergism; Histone deacetylase inhibitors; Metformin; Triple-negative breast neoplasms.


Conflict of interest statement

Declarations. Ethics approval and consent to participate: This study complied with all ethical regulations regarding animal experimentation. The use of animals was approved by the Institutional Animal Care and Use Committee of Tongji University (Permit Number: SYXK 2020-0002). Consent for publication: All authors have consented to the publication of this manuscript. This manuscript does not contain data from any individual person; therefore, additional consent for publication is not required. Competing interests: No potential conflicts of interest were disclosed.

Figures

Fig. 1
Fig. 1
The overview of the CMap drug sensitivity analysis and its results were displayed. A Schematic representation of the CMap analysis workflow. B, C Volcano plots displaying differentially expressed genes. The highlighted genes corresponded to the top 150 upregulated and downregulated genes used as input for the CMap analysis. (B) compared the SAHA-treated group with the control group; (C) compared the Metformin-treated group with the control group. D Heatmap of the top 50 predicted sensitive drugs based on the gene expression profile of the SAHA-treated group, ranked by Normalized Connectivity Score, illustrating potential synergistic or antagonistic effects
Fig. 2
Fig. 2
SAHA and metformin worked synergistically to inhibit TNBC. A The DTSyn algorithm calculated the drug synergy probability between Metformin and SAHA/Vorinostat in breast cancer cell lines. B Sensitivity scores for the drug combination (Metformin and Vorinostat/Zolinza [SAHA]) across different breast cancer subtypes. The heatmap on the left displayed the sensitivity of various breast cancer cell lines to the drug combination, the bar chart in the middle showed the average sensitivity score for each breast cancer subtype, and the definitions of the five sensitivity scores were provided on the right. C The percentage inhibition (up panel) and CI (down panel) at each concentration of the drugs were presented. MDA-MB-231 cells were treated with SAHA, metformin, or both at the concentrations as indicated. D The colony formation assay and its quantification of MDA-MB-231 cells treated with SAHA, metformin, or their combination were presented. MDA-MB-231 cells (1,000 per well) were seeded into six-well plates and treated after 24 h with varying concentrations of SAHA, metformin, or their combination. After 14 days, colonies were stained with crystal violet, quantified using ImageJ, and plotted with GraphPad Prism 7.0. All experiments were performed in triplicate. Error bars represented means ± SD from triplicates. *p < 0.05, **p < 0.01, ***p < 0.001, ****p < 0.0001
Fig. 3
Fig. 3
Metformin reversed SAHA-induced feedback activation by inhibiting histone acetylation on FGFR4. A The Venn diagram displayed the intersection of upregulated genes in the SAHA-treated group, downregulated genes in the Metformin-treated group, downregulated genes in the SAHA + Metformin combination group, and membrane receptor genes. B GSEA analysis was performed on the differential expression results between the SAHA-treated group and the control group. C Immunoblotting showed the change in FGFR4 and STAT3 phosphorylation. MDA-MB-231 cells pretreated with JQ1 for 24 h were exposed to SAHA for a further 12 h. FGFR4 and STAT3 phosphorylation changes were detected by immunoblotting. All bands were quantified from experiments repeated three times. D Histone acetylation on the FGFR4 promoter. (Left) MDA-MB-231 cells were treated with SAHA (5 μM) for 12 h before being subjected to ChIP assay using anti-acetylhistone H3K9 (Ac-H3K9) antibody followed by qPCR analysis using primers targeting the indicated FGFR4 promoter region. (Middle) BRD4 enrichment on the FGFR4 promoter. MDA-MB-231 cells were treated with SAHA (5 μM) for 12 h before being subjected to ChIP assay using anti-BRD4 antibody. qPCR analysis was performed using primers targeting the indicated FGFR4 promoter region. (Right) MDA-MB-231 cells were treated with Metformin (20 mM) for 48 h before being subjected to ChIP assay using anti-acetylhistone H3K9 (Ac-H3K9) antibody followed by qPCR analysis using primers targeting the indicated FGFR4 promoter region. All experiments were performed in triplicate. Error bars represent means ± SD from triplicates. *p < 0.05, **p < 0.01, ***p < 0.001, ****p < 0.0001. E FGFR4 mRNA level changes. MDA-MB-231, BT-549, and HCC1806 cells were treated with SAHA (5 μM) for 24 h or metformin (20 mM) for 48 h. Samples were analyzed by qPCR assay. Error bars represent means ± SD from triplicates. *p < 0.05, **p < 0.01, ***p < 0.001, ****p < 0.0001. F Immunoblotting showed the change in FGFR4 and STAT3 phosphorylation. (Left) MDA-MB-231 cells were treated with indicated SAHA (0, 5, 10 μM) for 12 h. (Middle) MDA-MB-231 cells were treated with indicated metformin (0, 10, 20, 40 mM) for 48 h. (Right) MDA-MB-231 cells pretreated with metformin (20 mM) for 36 h were exposed to SAHA (5 μM) for further hours. FGFR4 and STAT3 phosphorylation changes were detected by immunoblotting. All bands were quantified from experiments repeated three times
Fig. 4
Fig. 4
Metformin enhanced SAHA's efficacy in TNBC through metabolic reprogramming. A GSEA analysis was conducted on the differential expression results between the metformin-treated group and the control group. B The mRNA levels of metabolism-related genes (SLC2A, LDHA, PFKL) were measured. MDA-MB-231 cells were treated with 2 μM DMSO or 20 mM metformin for 48 h. C ECAR was measured in MDA-MB-231 and HCC1806 cells exposed to 2 μM DMSO, 5 μM SAHA, 20 mM metformin, or 5 μM SAHA + 20 mM metformin. The ECAR was analyzed using the Seahorse XF Glycolysis Stress Test Kit and the Seahorse XFe96 analyzer. The ECAR values were measured from 3 wells per sample, and the experiments were repeated three times. D ECAR was measured in MDA-MB-231 and HCC1806 cells transfected with NC or FGFR4 siRNAs for 48 h before exposure to 2 μM DMSO or 5 μM SAHA for 24 h. The ECAR was analyzed using the Seahorse XF Glycolysis Stress Test Kit and the Seahorse XFe96 analyzer. The ECAR values were measured from 3 wells per sample, and the experiments were repeated three times
Fig. 5
Fig. 5
Combination of Metformin and SAHA inhibited the growth of subcutaneous tumors in mice. A, B Tumor images (A) and tumor growth curve (B) from each treatment group of the MDA-MB-231 xenograft model (n = 8). Mice were orally treated with SAHA (100 mg/kg) and metformin (200 mg/kg) alone or in combination daily for up to 4 weeks. Tumors were collected and measured 8 h after the last dosing (A) and the tumor growth curve was plotted by measuring the relative tumor volume twice per week (B). Scale bar, 1 cm. Error bars represented means ± SD from triplicates. *p < 0.05, **p < 0.01, ***p < 0.001, ****p < 0.0001. C Molecular alterations in the MDA-MB-231 subcutaneous xenograft model. Tumor samples, as described in (A), were collected 8 h after the last dosing, and intratumoral molecular changes were detected using immunohistochemistry analysis. Scale bar, 20 mm. D Proposed working model. We investigated the synergistic effects of the HDAC inhibitor SAHA and metformin in TNBC using multiple computational methods (CMap, DTsyn, and DrugComb) and bioinformatics predictions (CRISPR/Cas9 screening). The results were further validated through in vitro and in vivo experiments, elucidating the underlying mechanisms. Metformin inhibits the upregulation of histone acetylation on FGFR4, thereby suppressing the feedback activation induced by SAHA. This, in turn, affects its downstream pathways (FGFR4-JAK1-STAT3, FGFR4-AKT, and FGFR4-ERK), leading to the suppression of cancer cell proliferation and anti-apoptotic responses. Additionally, metformin influences glycolysis and metabolic genes (e.g., SLC2A, LDHA, PFKL), participating in metabolic reprogramming, which enhances the efficacy of SAHA in TNBC

References

    1. Gupta I, Sareyeldin RM, Al-Hashimi I, Al-Thawadi HA, Al Farsi H, Vranic S, et al. Triple negative breast cancer profile, from gene to microRNA, in relation to ethnicity. Cancers. 2019. 10.3390/cancers11030363. - PMC - PubMed
    1. Yin L, Duan JJ, Bian XW, Yu SC. Triple-negative breast cancer molecular subtyping and treatment progress. Breast Cancer Res BCR. 2020;22(1):61. - PMC - PubMed
    1. Chen L, Zhang T, Sun S, Ren W, Wu A, Xu H. Ultrasound-mediated cavitation enhances EGFR-targeting PLGA-PEG nano-micelle delivery for triple-negative breast cancer treatment. Cancers. 2021. 10.3390/cancers13143383. - PMC - PubMed
    1. Bonotto M, Gerratana L, Poletto E, Driol P, Giangreco M, Russo S, et al. Measures of outcome in metastatic breast cancer: insights from a real-world scenario. Oncologist. 2014;19(6):608–15. - PMC - PubMed
    1. Redig AJ, McAllister SS. Breast cancer as a systemic disease: a view of metastasis. J Intern Med. 2013;274(2):113–26. - PMC - PubMed

LinkOut - more resources