. 2025 May;12(17):e2405399.
doi: 10.1002/advs.202405399. Epub 2025 Mar 16.

CCL20/CXCL5 Drives Crosstalk Between Anaplastic Thyroid Cancer Stem Cells and Tumor-Associated Macrophages to Promote Tumor Progression

Affiliations

CCL20/CXCL5 Drives Crosstalk Between Anaplastic Thyroid Cancer Stem Cells and Tumor-Associated Macrophages to Promote Tumor Progression

Qi Liu et al. Adv Sci (Weinh). 2025 May.

Abstract

The dynamic interplay between tumor-associated macrophages (TAMs) and anaplastic thyroid cancer (ATC) shapes the tumor microenvironment and facilitates ATC progression. However, the mechanisms of communication between TAMs and anaplastic thyroid cancer stem cells (ATCSCs) remain largely unelucidated. Integrative analyses of single-cell RNA sequencing, cytokine/chemokine arrays, proteomics, and mRNA expression datasets are performed to reveal crosstalk between TAMs and ATCSCs and signaling pathways in ATCSCs. Subsequently, in vitro experiments are performed to validate the regulatory effects of key cytokines on ATCSC stemness. Last, xenogeneic orthotopic thyroid ATCSCs transplantation models are utilized to corroborate the regulatory effect of cytokines on stemness. CCL20 derived from THP-1-M2 activates the IRAK-1/NF-κB1/2 signaling pathway in ATCSCs, thereby positively regulating stemness characteristics and upregulating CXCL5 secretion. ATCSCs not only exhibit autocrine CXCL5 participation in the regulation of stemness but also demonstrate paracrine CXCL5 activity to recruit THP-1-Mφ and maintain the M2 phenotype. CCL20 and CXCL5 are involved in the crosstalk between TAMs and ATCSCs. The CCL20/CXCL5 axis plays a crucial role in the interaction between TAMs and ATCSCs, establishing a progressive tumor microenvironment.

Keywords: CCL20; CXCL5; anaplastic thyroid cancer; cancer stem cell; crosstalk; tumor microenvironment.


Conflict of interest statement

The authors declare no conflict of interest.

Figures

Figure 1
Figure 1
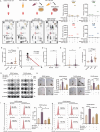
THP‐1‐M2 macrophages and ATCSCs establish an advanced tumor microenvironment. A) UMAP plot demonstrating 8 clusters based on unsupervised clustering for thyrocytes passing quality control. B) Bar plots indicate the proportion of 8 cell clusters in the normal thyroid tissue, PTC, and ATC groups. C) UMAP plot demonstrating 6 distinct clusters based on gene expression differences in myeloid cells. D) Bar plots indicate the proportion of 6 cell clusters in myeloid cells. E) Circle plots show the comparison of interaction quantity and interaction strength between CD206+ M2 macrophage and CD133+ CSC. F) Circle plots show the comparison of the interaction strength between CD206+ M2 macrophage and CD133+ CSC. G) Comparison of the differences in specific cell communication intensity between M1 and M2 macrophage with CD133+ CSC. H) The expression levels of CD206+ M2 macrophages were positively correlated with CD133+ CSC. I) Illustration of CD133+ ATCSCs induced by ATC cell lines sorted by magnet‐activated cell sorting. J) Flow cytometry analysis of changes in CD133 positive rates before and after magnetic‐activated cell sorting of spheres (n = 3). K) Flow cytometry analysis of changes in CD206 or CD86 positive rates of THP‐1‐M1 and THP‐1‐M2 (n = 3). L) The expression levels of CD133, OCT‐4, SOX‐2, and Nanog were detected in the spheres before and after magnetic‐activated cell sorting (n = 3). M) Self‐renewal ability of spheres was detected in co‐culture with or without THP‐1‐M2 CM (n = 3). N) The expression levels of CD133, OCT‐4, SOX‐2, and Nanog were detected in the co‐culture with or without THP‐1‐M2 CM (n = 3). O) Flow cytometry analysis of changes in CD133 positive rates of spheres in co‐culture with or without THP‐1‐M2 CM (n = 3). P) Flow cytometry analysis of changes in CD206 positive rates of THP‐1‐Mφ in co‐culture with CD133+ spheres or CD133 sphere CM (n = 3). *p < 0.05, **p < 0.01, ***p < 0.001; Student's t‐test, Pearson correlation analysis, Error bars, mean ± SD.
Figure 2
Figure 2
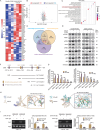
The CCL20/CXCL5 axis is critical for TAM and ATCSC construction in an advanced tumor microenvironment. A) Representative images of chemokine array analysis of 8305C‐ATCSC and THP‐1‐M2 and their co‐culture. B) The mRNA levels of CXCL5 were compared in normal thyroid tissue, PCT, and ATC from GEO datasets. C) Correlation analysis of CXCL5 mRNA expression and thyroid differentiation score in human thyroid cancers from GEO datasets. D) The mRNA levels of CXCL5 were compared between normal thyroid tissue and thyroid cancer from TCGA datasets. E) The mRNA levels of CXCL5 were compared in N0 and N1 stages from TCGA datasets. F) The mRNA levels of CCL20 were compared in normal thyroid tissue, PCT, and ATC from GEO datasets. G) The expression levels of CD133, OCT‐4, SOX‐2, and Nanog were detected in spheres with or without CCL20 and/or CXCL5 (n = 3). H) Self‐renewal ability of spheres was detected in co‐culture with or without CCL20 and/or CXCL5 (n = 3). I) Flow cytometry analysis of changes in CD133 positive rates of spheres in co‐culture with or without CCL20 and/or CXCL5 (n = 3). *p < 0.05, **p < 0.01, ***p < 0.001, ns, no significance; Mann–Whitney U analysis, Pearson correlation analysis, Two‐way ANOVA test, Error bars, mean ± SD.
Figure 3
Figure 3
CCL20 upregulates IRAK1 and activates NF‐κB1/2 through a phosphorylation cascade to promote CXCL5 transcription. A) Differential protein levels in CAL62‐ATCSC with and without the addition of CCL20 analyzed by proteomics (n = 3). B) Upregulated versus downregulated proteins as revealed by proteomic analysis. C) Protein association network analysis and enrichment of potential signaling pathways. D) Intersection analysis of differential proteins, genes positively associated with CCL20, and potential transcription factors of CXCL5. E) The expression levels of IRAK‐1, IKK‐α, IKBα, P65, and P52, as well as the phosphorylation levels of p‐IRAK1, p‐IKKα, p‐IKBα, and p‐P65, were measured in ATCSC after the addition of CCL20 or CCR6 inhibitor (n = 3). F. Schematic diagram of potential binding elements of NF‐κB1/2 in the CXCL5 promoter region. G) Analysis of changes in luciferase activity of different truncated plasmids of NF‐κB1/2 using a dual luciferase reporter assay (n = 3). H. Molecular docking analysis of NF‐κB1/2 with CXCL5 specific binding elements. I. ChIP analysis of the binding ability between NF‐κB1/2 and the binding elements (n = 3). *p < 0.05, **p < 0.01, ns, no significance; Student's t‐test, Two‐way ANOVA test, Error bars, mean ± SD.
Figure 4
Figure 4
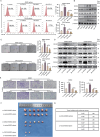
CXCL5 derived from ATCSCs recruits THP‐1‐Mφ macrophages and induces polarization toward the M2 phenotype. A) Illustration of indirect co‐culture between THP‐1‐Mφ and ATCSC. B) Analysis of migration ability of THP‐1‐Mφ after indirect co‐culture with 8305C‐ATCSC or CAL62‐ATCSC overexpressing or silencing of CXCL5 (n = 3). C) Flow cytometry analysis of THP‐1‐Mφ after indirect co‐culture with 8305C‐ATCSC or CAL62‐ATCSC overexpressing or silencing CXCL5. D) The mRNA levels of IL‐1β, TNF‐α, CD163, CCL22, and IL‐10 were measured in THP‐1‐Mφ after indirect co‐culture with 8305C‐ATCSC overexpressing or silencing CXCL5. E) The expression levels of JAK2 and STAT3, as well as the phosphorylation levels of p‐JAK2 and p‐STAT3, were measured in ATCSC after the addition of CXCL5 or CXCR2 inhibitor (n = 3). F) Flow cytometry was used to analyze the changes in CD206 positivity rate in THP‐1‐Mφ after the addition of CXCL5 or CXCR2 inhibitor (n = 3). *p < 0.05, **p < 0.01, ***p < 0.001; Student's t‐test, two‐way ANOVA test, Error bars, mean ± SD.
Figure 5
Figure 5
CXCL5 is essential for promoting the stemness characteristics of ATCSCs. A) Flow cytometry was used to analyze the changes in CD133 positivity rate in Lv‐CXCL5‐sphere and Sh‐CXCL5‐sphere (n = 3). B) The expression levels of CD133, OCT‐4, SOX‐2, Nanog, and CXCL5 were measured in three thyroid papillary carcinoma cell lines (BCPAP, KTC‐1, and IHH4) and four ATC cell lines (8305C, KMH2, 8305C, and CAL62). C) The self‐renewal ability of spheres was detected in Lv‐CXCL5‐sphere and Sh‐CXCL5‐sphere (n = 3). D) The expression levels of CD133, OCT‐4, SOX‐2, Nanog, and CXCL5 were measured in Lv‐CXCL5‐sphere and Sh‐CXCL5‐sphere (n = 3). E) The invasion ability of 8305C and CAL62 with CXCL5 overexpression or silencing was analyzed using Transwell assays (n = 3). F,G) Changes in limiting dilution tumorigenesis rate and tumor size of 8305C‐sphere overexpressing or silencing CXCL5 in vivo (n = 6). *p < 0.05, ***p < 0.001; Student's t‐test, Error bars, mean ± SD. *p < 0.05, **p < 0.01, ***p < 0.001; Student's t test, Error bars, mean ± SD.
Figure 6
Figure 6
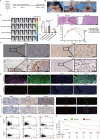
In vivo and clinical evidence of CCL20/CXCL5 axis in advanced tumor microenvironment. A) Illustration of the ATCSC orthotopic transplantation model. B) ATCSC transplantation in BALB/c‐nu mice and the invasion of tumors after 5 weeks. C) The in vivo images of mouse tumors with different treatments were detected using the imaging system (n = 6). D) HE staining of the thyroid orthotopic xenograft model in BALB/c‐nu mice. E) Differences in body weight changes over time between groups of BALB/c‐nu mice. F) Immunohistochemical analysis showing representative images of CXCL5, CD133, CD163, and Ki67 expression in the thyroid orthotopic xenograft model. G) Immunofluorescence co‐localization analysis showing representative images of CXCL5, CD133, CD163, and Ki67 expression in the thyroid orthotopic xenograft mode. H) Immunohistochemical analysis showing representative images of the correlation between CXCL5, CD133, and CD163 in human ATC tissues. I) Immunofluorescence co‐localization analysis showing representative images of CXCL5, CD133, CD163, and Ki67 expression in human ATC tissues. J) The correlation of CXCL5, CD133, and CD163 in human ATC tissues was analyzed by flow cytometry with panoramic immunohistochemistry. K) Survival analysis of ATC patients with CXCL5 expression using the Kaplan‐Meier curve. *p < 0.05, **p < 0.01, ***p < 0.001, ns, no significance; Two‐way ANOVA test, Error bars, mean ± SD.
Figure 7
Figure 7
Illustration of the crosstalk between THP‐1‐M2 and ATCSC via the CCL20/CXCL5 axis.

References

    1. Bible K. C., Kebebew E., Brierley J., Brito J. P., Cabanillas M. E., Clark T. J. Jr., Di Cristofano A., Foote R., Giordano T., Kasperbauer J., Newbold K., Nikiforov Y. E., Randolph G., Rosenthal M. S., Sawka A. M., Shah M., Shaha A., Smallridge R., Wong‐Clark C. K., Thyroid 2021, 31, 337. - PMC - PubMed
    1. Smallridge R. C., Ain K. B., Asa S. L., Bible K. C., Brierley J. D., Burman K. D., Kebebew E., Lee N. Y., Nikiforov Y. E., Rosenthal M. S., Shah M. H., Shaha A. R., Tuttle R. M., Thyroid 2012, 22, 1104. - PubMed
    1. Rao S. N., Zafereo M., Dadu R., Busaidy N. L., Hess K., Cote G. J., Williams M. D., William W. N., Sandulache V., Gross N., Gunn G. B., Lu C., Ferrarotto R., Lai S. Y., Cabanillas M. E., Thyroid 2017, 27, 672. - PMC - PubMed
    1. Smallridge R. C., Copland J. A., Clin. Oncol. (R. Coll. Radiol.) 2010, 22, 486. - PMC - PubMed
    1. Maniakas A., Dadu R., Busaidy N. L., Wang J. R., Ferrarotto R., Lu C., Williams M. D., Gunn G. B., Hofmann M. C., Cote G., Sperling J., Gross N. D., Sturgis E. M., Goepfert R. P., Lai S. Y., Cabanillas M. E., Zafereo M., JAMA Oncol. 2020, 6, 1397. - PMC - PubMed

MeSH terms

LinkOut - more resources